
One platform — standardized, built and operated by many.
One platform — standardized, built and operated by many.
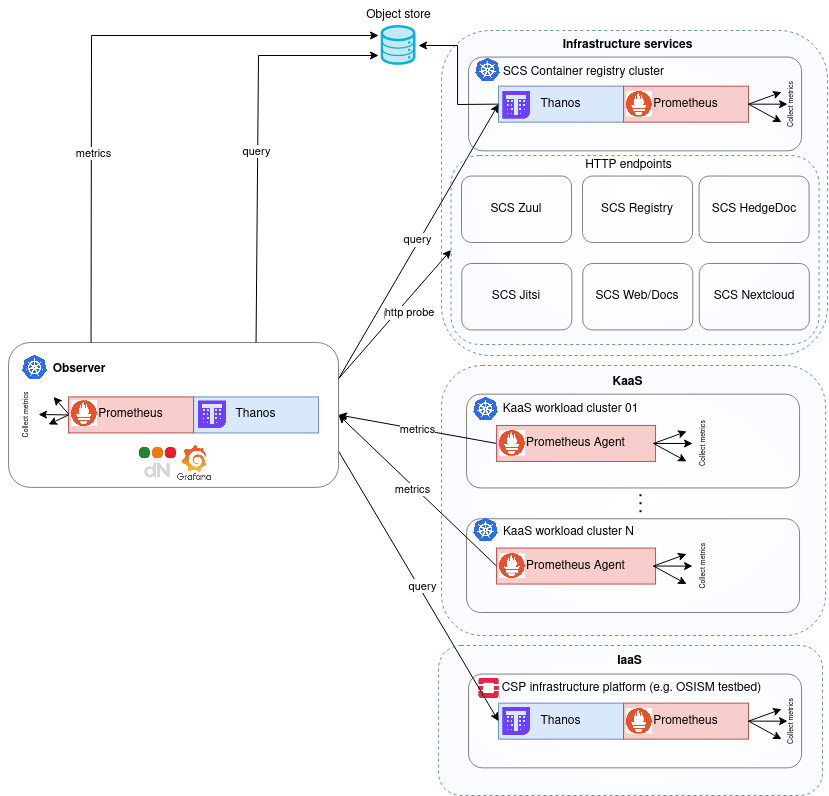
We’re excited to announce that our Minimum Viable Product (MVP) for extending the monitoring from the IaaS layer to a solution that covers observability and monitoring full-stack has achieved a presentable and viable state. MVP aims to provide a global monitoring view of various SCS layers and components, including KaaS, IaaS, and actively used services within the SCS community such as Jitsi, HedgeDoc, Nextcloud, Harbor container registry, and more. The global view is made possible by the Observer monitoring solution we’ve designed. The Observer enables the collection, storage, and visualization of metrics from the SCS infrastructure.
While the Observer monitoring solution is currently part of the MVP, our vision is to evolve it into an SCS product in future versions, once it reaches the required stability. Monitoring of the KaaS layer, monitoring of the IaaS layer, and monitoring of infrastructure services are illustrative examples of how this Observer monitoring solution can be utilized. Furthermore, the stack employed for observing the KaaS layer and infrastructure services is also designed to evolve into an SCS product in future stable versions.
The diagram below provides a high-level overview of the architecture implemented in our MVP. To explore the code and detailed documentation, head over to the k8s-observability repository. If you’re keen on delving deeper, check out the repository’s README and try setting up your own MVP deployment locally using KinD.
Furthermore, we’ve deployed the MVP publicly, offering handy and well-organized dashboards that showcase metrics gathered from the SCS infrastructure. Be sure to check out the upcoming blog section for the Observer (Grafana UI) links. It’s a must-see!
To enhance your experience, we’ve made the monitoring of the KaaS layer more interactive. You can create your own Kubernetes cluster and observe how it gets registered and visualized in the Observer. It’s worth giving it a try!
The SCS Monitoring MVP is developed on the foundation of the dNation monitoring solution.
Disclaimer: Please be aware that the MVP demo URLs referenced in the sections below are expected to be unavailable within the next couple of months. We appreciate your understanding.
As mentioned earlier, we aim to showcase how the Observer monitors the CSP KaaS offering. To make this demonstration interactive, we’ve developed a KaaS mock service, allowing you to easily create a Kubernetes cluster.
The KaaS mock service is accessible through Swagger UI.
Don’t hesitate to create your own Kubernetes cluster within approximately three minutes. You’ll find it displayed on the dedicated Observer high-level dashboard. For a deeper exploration of metrics, simply drill down and click on the cluster you created. Feel free to experiment, such as triggering monitoring alerts by initiating actions like destroying specific components 😎.
Please note that there is a restriction of a maximum of 10 clusters, as the KaaS mock service operates on a single VM. Additionally, it’s important to keep in mind that this monitoring solution isn’t real-time, meaning it doesn’t react immediately to your actions. However, you can typically expect a response within a few minutes.
To highlight the Observer’s capability in monitoring the IaaS layer, we utilized the OSISM testbed deployment as a demonstration within this MVP. The OSISM testbed has been patched, enabling the Observer to scrape metrics via the Thanos sidecar. Explore the dedicated Observer high-level dashboard for a list of alerts present in our OSISM testbed and access links to dashboards we copied (and made functional) from the testbed Grafana.
To demonstrate the Observer’s capability in monitoring CSP infrastructure services deployed on top of the IaaS layer, we chose to monitor key SCS infrastructure elements such as the SCS Observer cluster itself, the SCS Harbor Kubernetes cluster, and various endpoints of SCS services regularly used by the SCS community, including the SCS webpage, SCS docs page, SCS Jitsi instance, SCS HedgeDoc, and more. Explore the high-level infrastructure dashboard, drill down, and click on the service you want to investigate deeper.
For example, dive into detailed Harbor metrics by following this path: infrastructure dashboard -> harbor cluster -> scroll to the bottom and click on the harbor app dashboard.
🔍 Happy monitoring!