
One platform — standardized, built and operated by many.
One platform — standardized, built and operated by many.
During some weekly meetings of SCS Team Container and also SCS Team IaaS the question emerged whether or not generally enabling full disk encryption on servers - especially related to software defined storage like Ceph - should be the default.
While in general enabling disk encryption can be considered a good thing that many people would agree with, there is a difference between enabling FDE on your personal computing devices versus servers in a datacenter environment, especially when a lot of drives need to be encrypted.
The concerns voiced were that the performance impact would be tremendous. But since no actual data was available at hand to showcase how big that impact could become, I voluntered to dig into the matter at hand and do benchmarks.
Also with the availability of self encrypting drives, the practical application of that technology had to be evaluated.
The benchmarks show that the additional overhead for encryption on spinning disks is not that big regarding CPU load (at least compared to NVME), mainly because the drives and controllers are the limiting factor there.
So SAS HDDs (even across 24 of them) aren’t that big of a deal CPU-wise. It’s still measurable, but even for HCI nodes the impact is not so big that enabling encryption would possibly wreak havoc.
However bandwidth and IOPS losses are quite big and can lead - depending on the I/O pattern - to about 79 % performance penalty. Worst performance losses were seen with sequential write (up to 79 %) followed by sequential read (up to 53 %). Random I/O losses were worst with random writes (up to 43 %) followed by random read (up to 26 %). In some single benchmarks performance was better than without encryption, up to 5 times faster across a RAID-0 at 4 KiB sequential writes. This possibly can be attributed to optimized I/O queueing.
Recommendation: You can usually safely turn on disk encryption with HDDs, as it likely won't cause many problems regarding CPU load even within HCI. However the performance penalty in throughput and IOPS can be quite tremendous compared to non-encrypted operation.
On NVME all flash systems the load impact can be gigantic. A RAID 0 across just three LUKS encrypted NVME SSDs was enough to fully saturate the CPU on test system B.
It shows in the fio data when adding up usr_cpu and sys_cpu values.
During the benchmark runs I monitored the system additionally
with iostat and htop and the following htop screenshot shows
how big that impact can be.
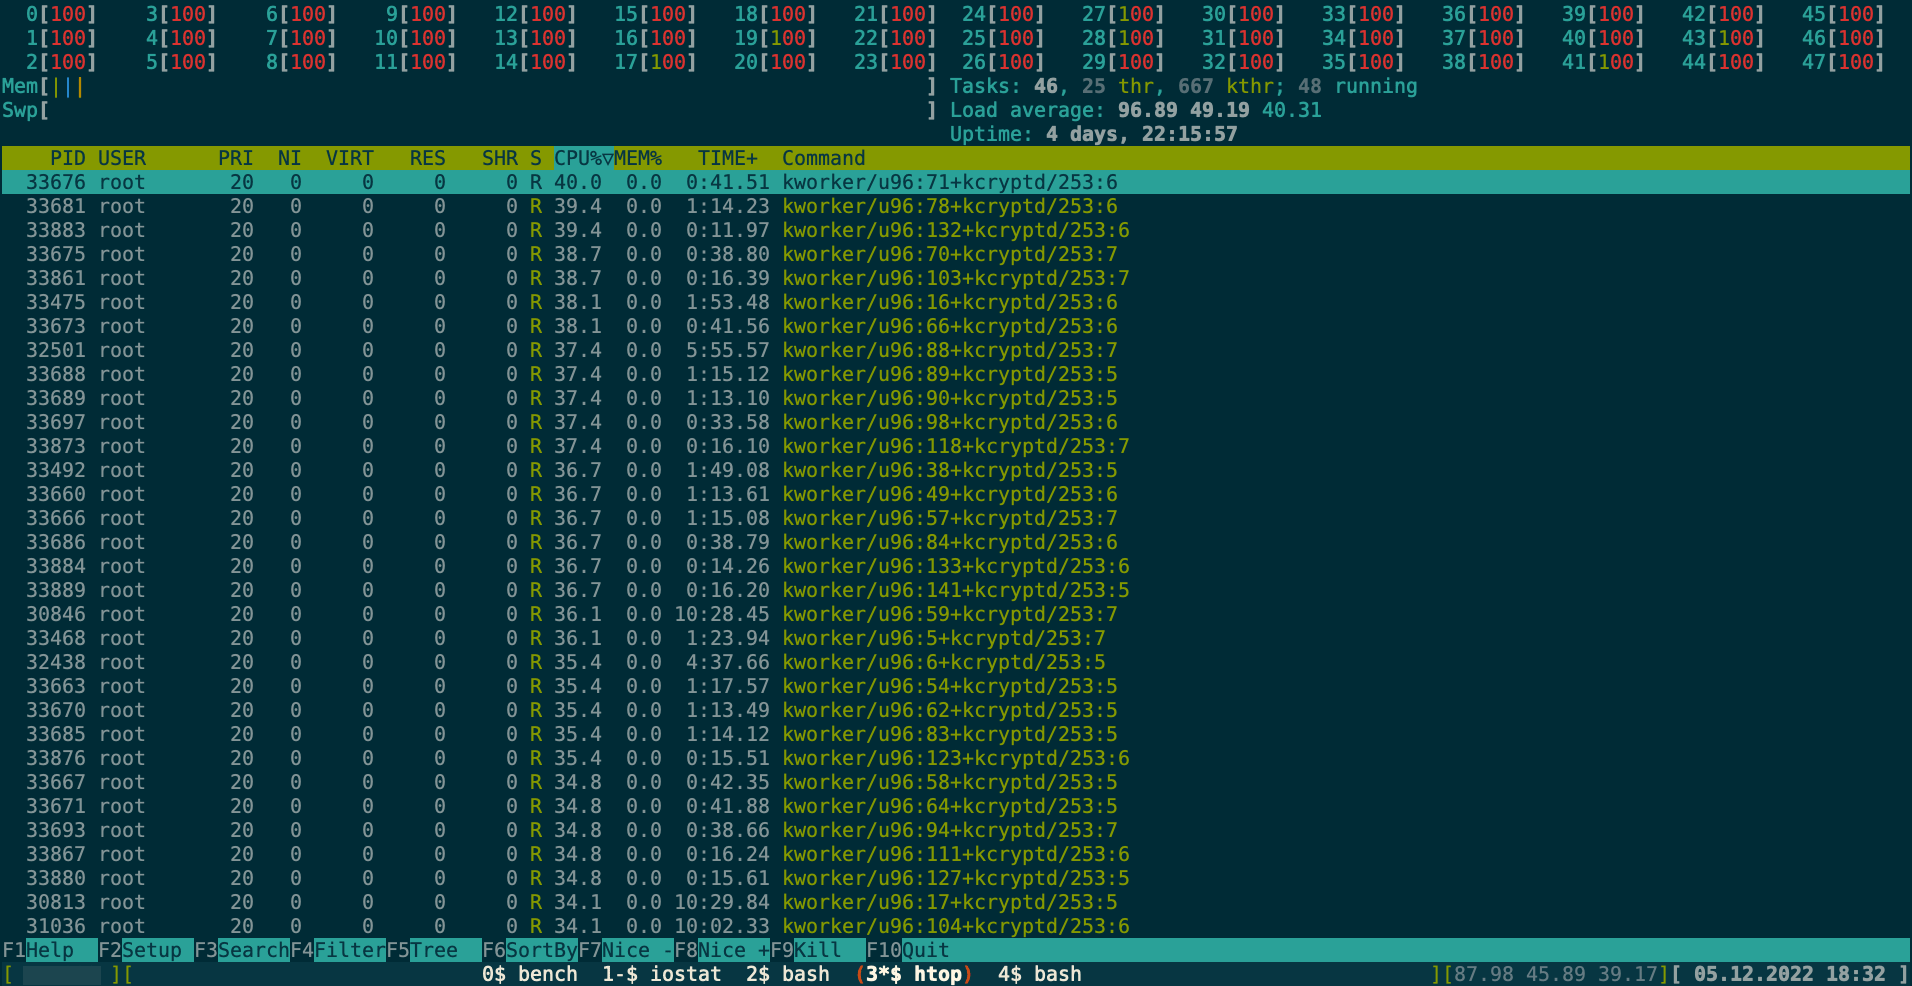
That's an AMD EPYC 7402P with 100% CPU load across all threads/cores!
This significantly increases power consumption and for HCI nodes would be bad for other workloads running on it.
Heat dissipation could then also be challenging when whole racks suddenly dissipate way more heat than before. At least cost for cooling on top of the increased power consumption of the nodes would be really bad.
Bandwidth and IOPS losses are also quite big and can
lead - depending on the I/O pattern - up to a 83 % performance penalty.
An I/O depth of 32 reduces the losses significantly. Worst performance losses
with encryption were measured with the RAID-0 in most cases.
Performance losses sorted by I/O type worst to best were random writes (up to 83 %),
sequential write (up to 83 %), sequential read (up to 81 %)
and finally random read (up to 80 %).
All these worst values were with I/O size 1 and 4 MiB
across the RAID-0 without I/O depth 32. One can clearly see however that
all these worst values are within 5 %, so its rather the I/O size combined
with the use of LUKS and MD RAID and not the drives.
Caution: It’s difficult to compare the performance of MD RAID with Ceph OSDs!
The performance impact when using Ceph could be totally different and will probably
be more oriented towards the losses of individual drives.
However the CPU load issue still remains.
Regarding the CPU load: There are crypto accelerator cards available which claim around 200 Gbps AES throughput and can integrate with dmcrypt through kernel modules.
These cards weren’t available for testing, but judging from prices on the used market (I didn’t find official price listings) for such cards and their power consumption specs they could provide a solution to offload the crypto operations from the CPU at a reasonable price point.
Recommendation: Further measurements regarding power consumption and crypto
accelerators could be done. Also testing with an actual Ceph cluster on all flash
is necessary to get a comparison of the losses compared to linux MD RAID.
Every provider needs to evaluate that separately depending on their own configurations
and hardware choices.
As of now the performance impact without accelerators is too big to recommend
generally enabling LUKS on NVME.
It was possible to activate the encryption with a passphrase utilizing
sedutil under linux. Performance impact was within measurement error,
so basically non-existent. That’s why in the section below I didn’t bother
creating charts - the results are too similar to plain operation (as expected).
Unfortunately the tooling in its current state is cumbersome to use,
also there would be a need to write scripts for integrating it into
NBDE setups.
(But it would be possible without too much hacking!)
However even though it technically works and performance impact is near zero, I encountered a severe showstopper for using that technology in servers, especially in cloud environments:
After powering down the system or manually locking the drive and rebooting, the system firmware stopped during POST to ask for the passphrase for each drive.
On the Supermicro server test system I found no way to disable that in BIOS/UEFI,
which makes that technology not reboot-safe and thus unusable in server environments.
Even worse was that even when trying to type in the passphrase,
it wasn’t accepted. So somehow the way sedutil stores the passphrase differs
from what the firmware does?
Recommendation: The tooling needs to be polished and documentation
significantly improved. Documentation on the tools is very confusing for the
general system administrator and can easily lead to operator errors.
Also due to the current BIOS/UEFI issues the technology cannot be recommended as of yet.
If vendors would provide a way to disable asking for the passphrase of certain drives it would be possible to use SEDs in a DC environment without the need of manual operator intervention when rebooting.
This concludes the TL;DR section.
So without further ado, let’s dig into the details.
Two different test systems were used. Since no dedicated systems could be
built/procured for the tests I used two readily available machines.
The specs of these are:
On both systems I performed a series of benchmarks with fio using some custom
scripts.
I chose to test the following block sizes, since they can offer some insight
into which I/O might cause what kind of load:
The following fio tests were performed:
All with option --direct and also repeated with --iodepth=32 option
and using libaio.
Those benchmarks were performed for:
Benchmarking Ceph itself was skipped, because no suitable test setup was available that offered both NVME and SAS OSDs. But since enabling Ceph encryption is using LUKS encrypted OSDs, the results should be useful nonetheless.
In case you want to run your own benchmarks, here is the script that was used to generate the data:
#!/bin/bash
LOGPATH="$1"
BENCH_DEVICE="$2"
mkdir -p $LOGPATH
IOENGINE="libaio"
DATE=`date +%s`
for RW in "write" "randwrite" "read" "randread"
do
  for BS in "4K" "64K" "1M" "4M" "16M" "64M"
  do
    (
    echo "==== $RW - $BS - DIRECT ===="
    echo 3 > /proc/sys/vm/drop_caches
    fio --rw=$RW --ioengine=${IOENGINE} --size=400G --bs=$BS --direct=1 --runtime=60 --time_based --name=bench --filename=$BENCH_DEVICE --output=$LOGPATH/$RW.${BS}-direct-`basename $BENCH_DEVICE`.$DATE.log.json --output-format=json
    sync
    echo 3 > /proc/sys/vm/drop_caches
    echo "==== $RW - $BS - DIRECT IODEPTH 32  ===="
    fio --rw=$RW --ioengine=${IOENGINE} --size=400G --bs=$BS --iodepth=32 --direct=1 --runtime=60 --time_based --name=bench --filename=$BENCH_DEVICE --output=$LOGPATH/$RW.${BS}-direct-iod32-`basename $BENCH_DEVICE`.$DATE.log.json --output-format=json
    sync
    ) | tee $LOGPATH/$RW.$BS-`basename $BENCH_DEVICE`.$DATE.log
    echo
  done
done
The script expects two parameters:
The script will produce a sequence of log files in JSON format, which can then be analyzed with tooling of your choice.
On both systems I first ran cryptsetup benchmark which performs
some general benchmarking of algorithm throughput.
This was done to obtain the best possible LUKS configuration regarding
throughput.
These were the results on test system A:
PBKDF2-sha1      1370687 iterations per second for 256-bit key
PBKDF2-sha256    1756408 iterations per second for 256-bit key
PBKDF2-sha512    1281877 iterations per second for 256-bit key
PBKDF2-ripemd160  717220 iterations per second for 256-bit key
PBKDF2-whirlpool  543867 iterations per second for 256-bit key
argon2i       5 iterations, 1048576 memory, 4 parallel threads (CPUs) for 256-bit key (requested 2000 ms time)
argon2id      5 iterations, 1048576 memory, 4 parallel threads (CPUs) for 256-bit key (requested 2000 ms time)
#     Algorithm |       Key |      Encryption |      Decryption
        aes-cbc        128b       904.3 MiB/s      2485.1 MiB/s
    serpent-cbc        128b        78.8 MiB/s       577.4 MiB/s
    twofish-cbc        128b       175.9 MiB/s       319.7 MiB/s
        aes-cbc        256b       695.8 MiB/s      2059.4 MiB/s
    serpent-cbc        256b        78.8 MiB/s       577.4 MiB/s
    twofish-cbc        256b       175.9 MiB/s       319.6 MiB/s
        aes-xts        256b      2351.5 MiB/s      2348.7 MiB/s
    serpent-xts        256b       560.1 MiB/s       571.4 MiB/s
    twofish-xts        256b       316.7 MiB/s       316.1 MiB/s
        aes-xts        512b      1983.0 MiB/s      1979.6 MiB/s
    serpent-xts        512b       560.5 MiB/s       571.3 MiB/s
    twofish-xts        512b       316.5 MiB/s       315.7 MiB/s
As you can see aes-xts 256 Bit performed the best, so when creating LUKS formatted devices
I chose -c aes-xts-plain64 -s 256 as parameters, which are also the defaults
in many modern distributions. But just to be on the safe side I specified them explicitly.
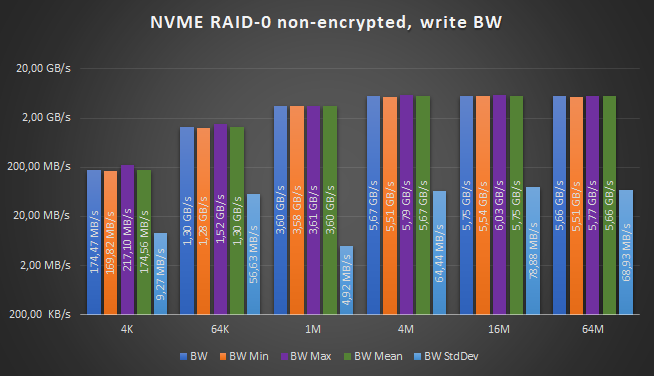
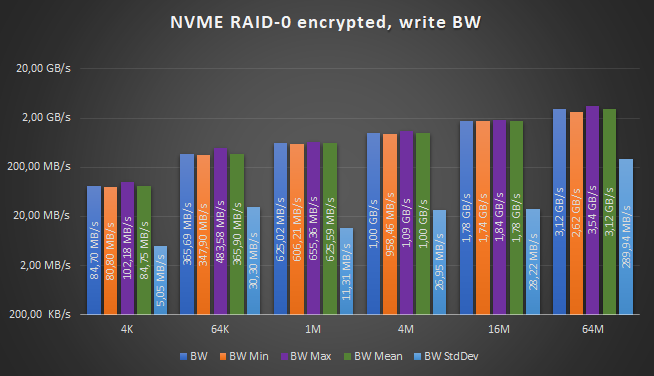
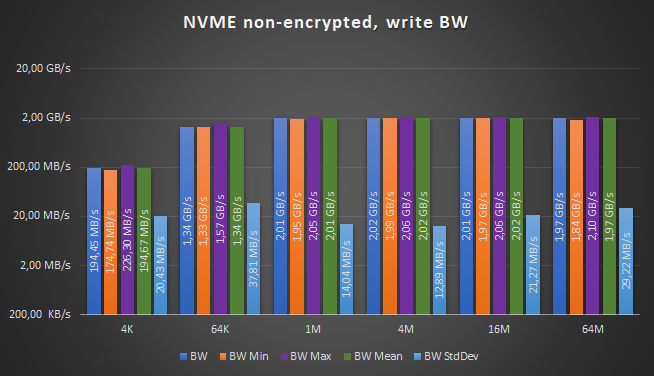
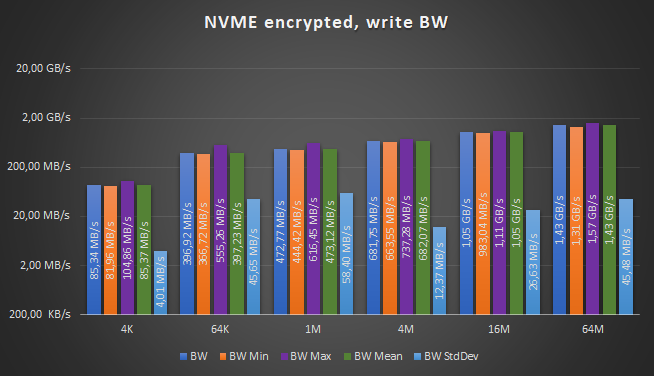
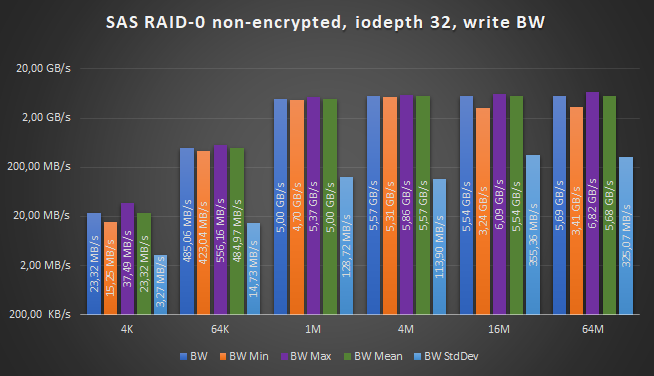
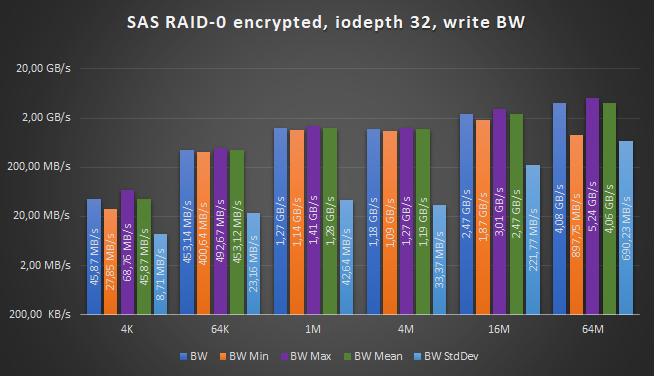
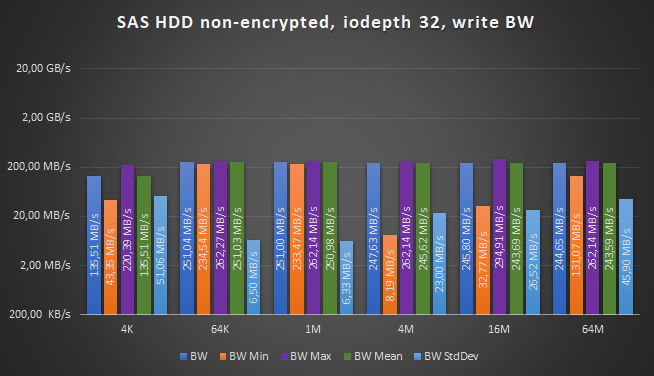
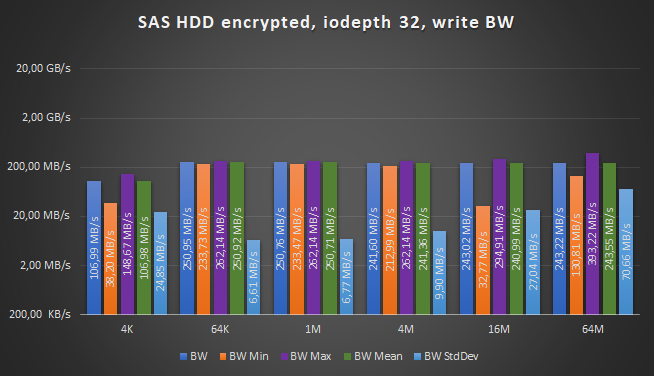
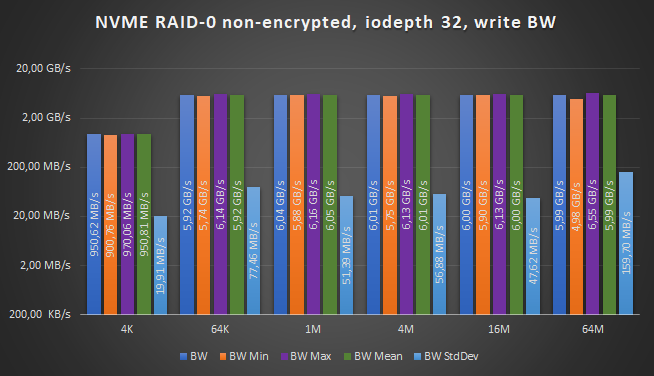
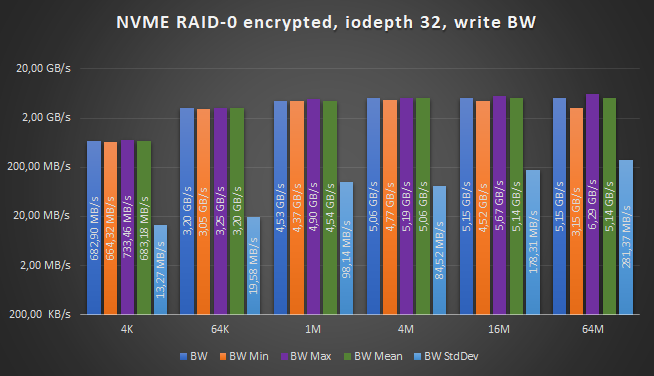
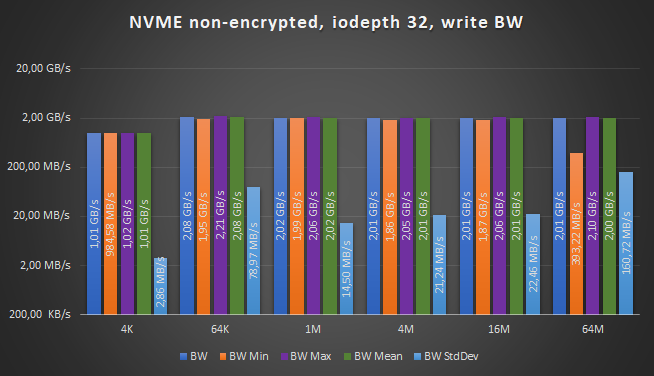
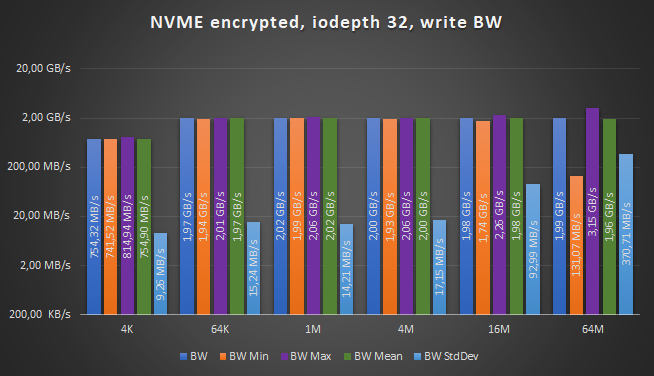
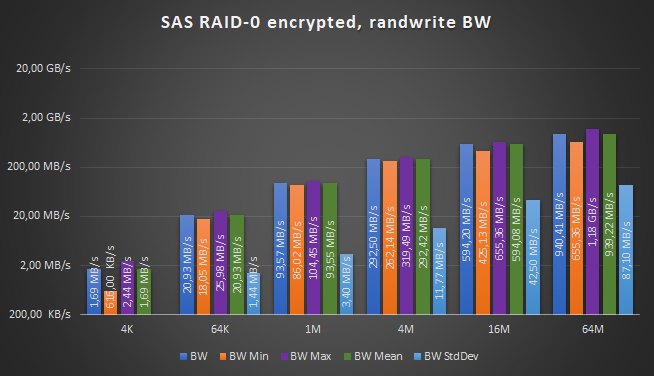
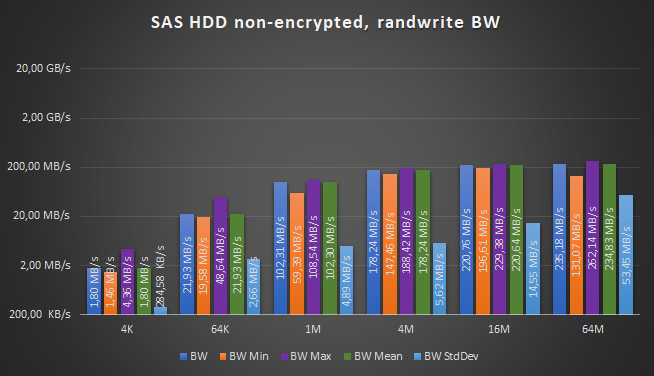
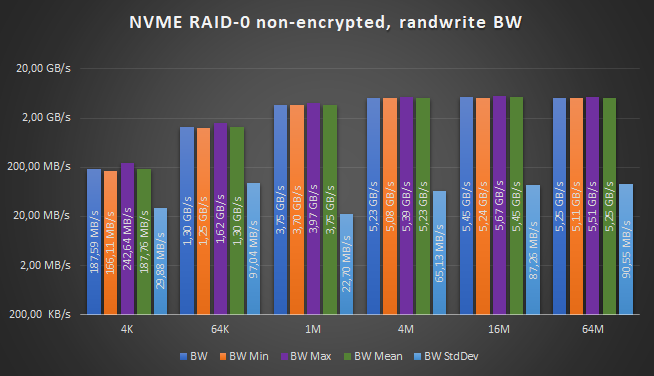
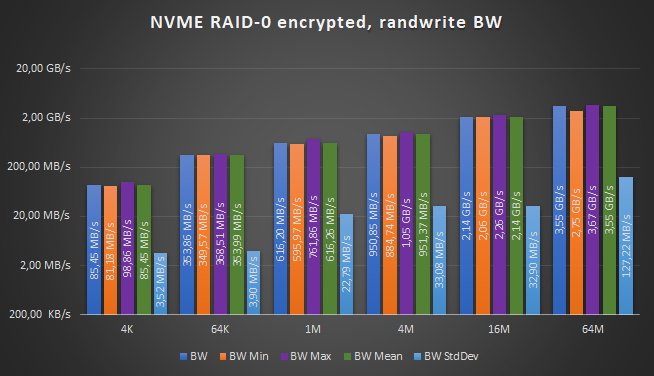
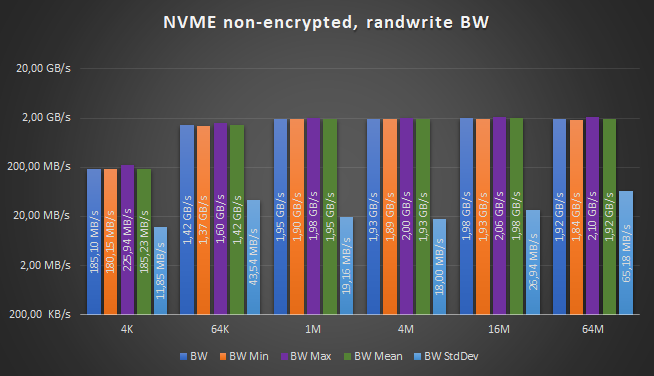
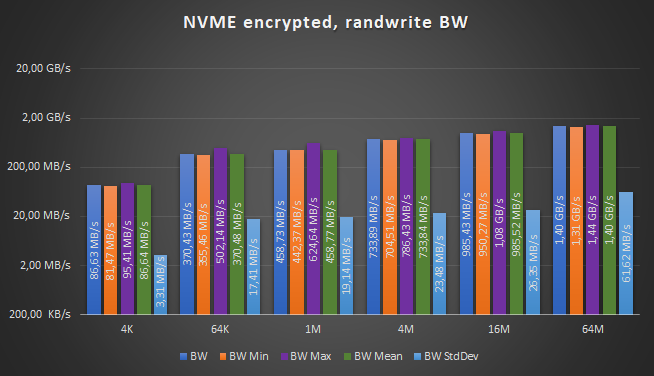
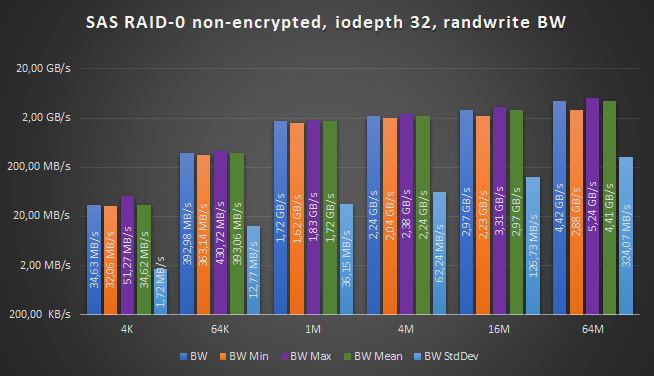
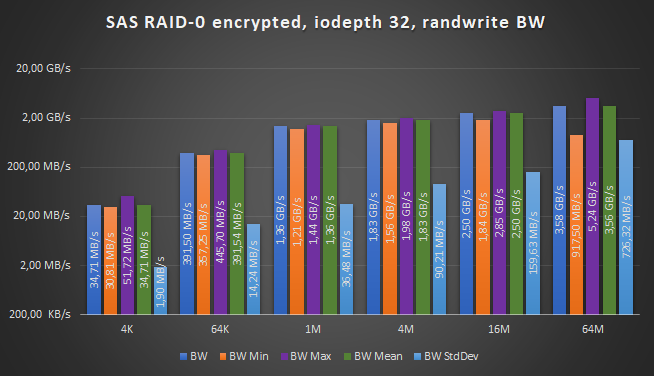
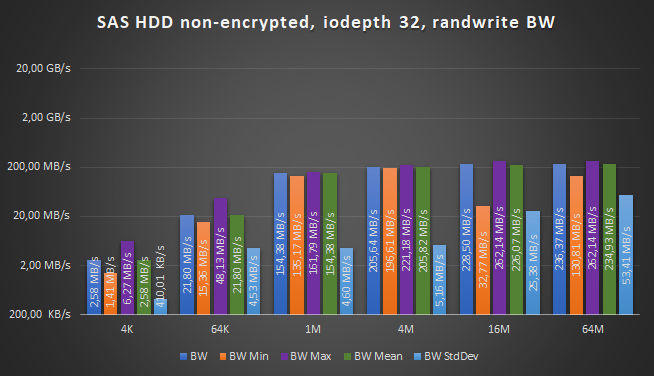
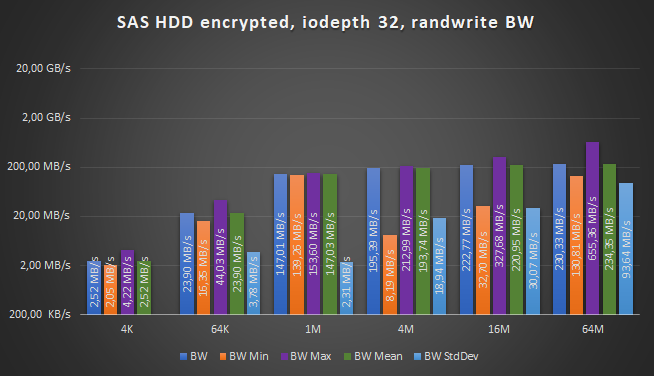
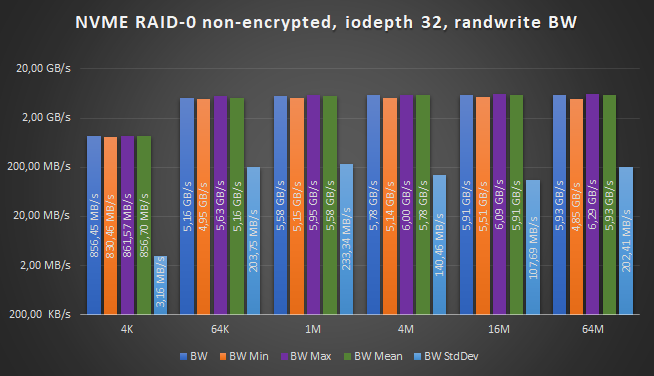
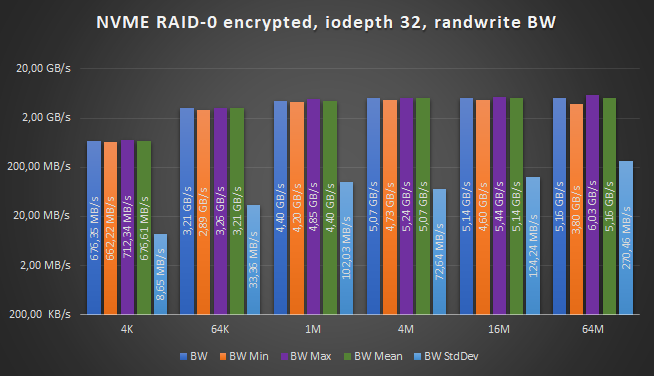
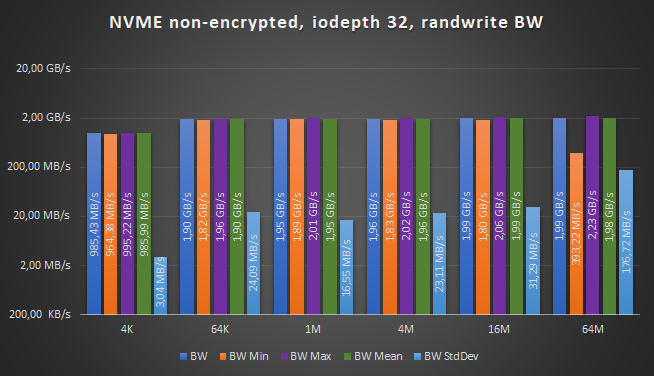
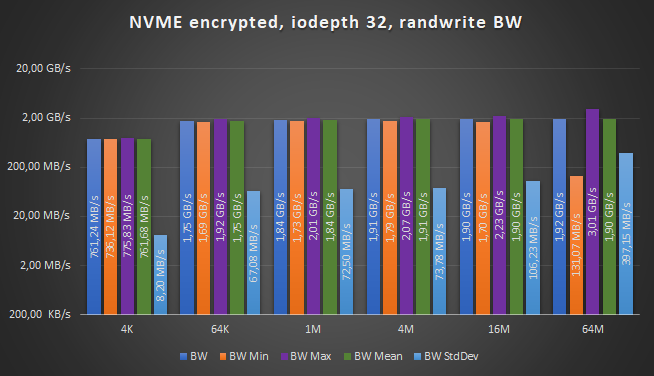
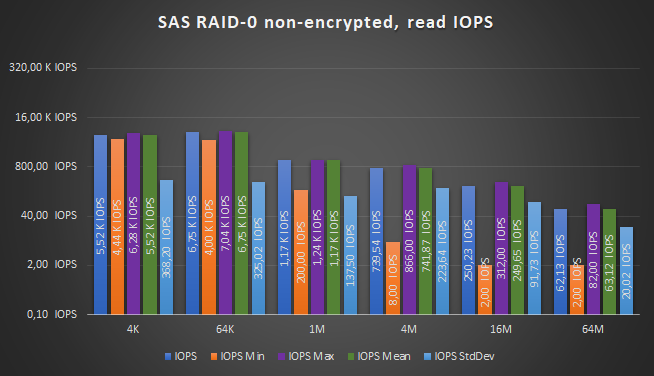
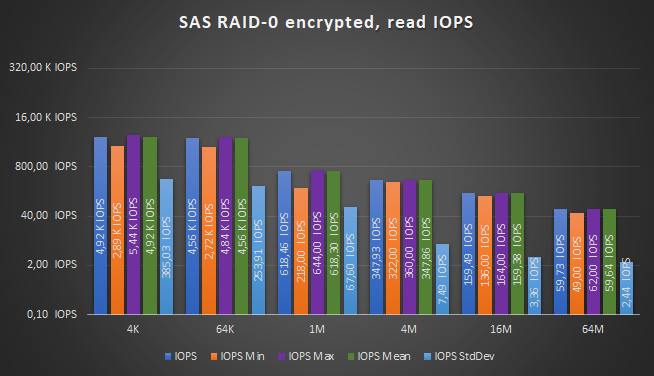
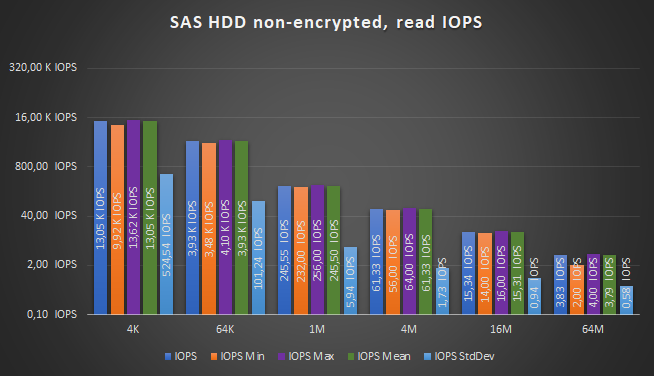
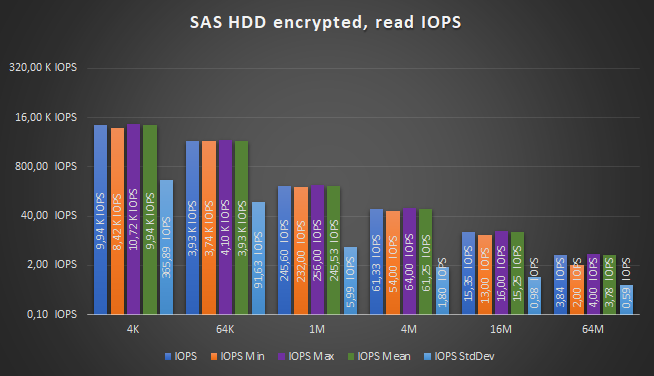
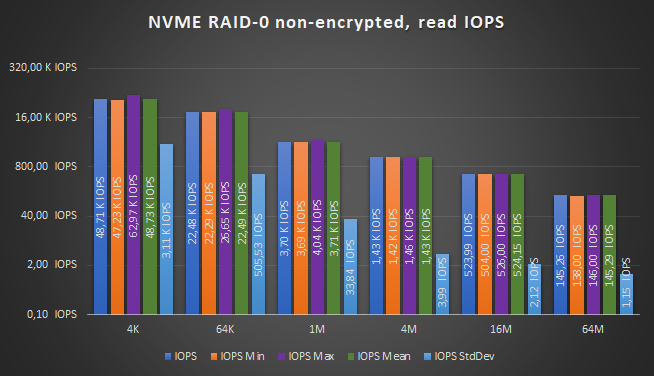
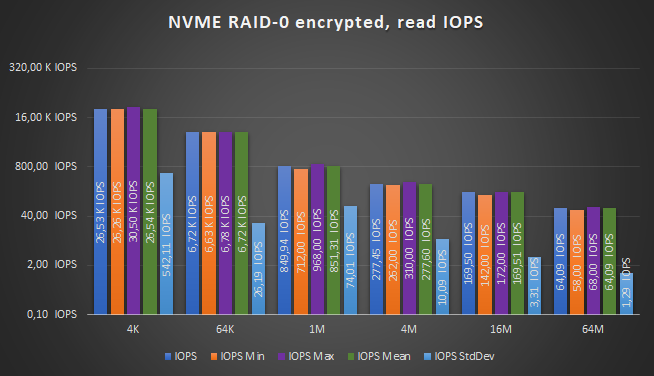
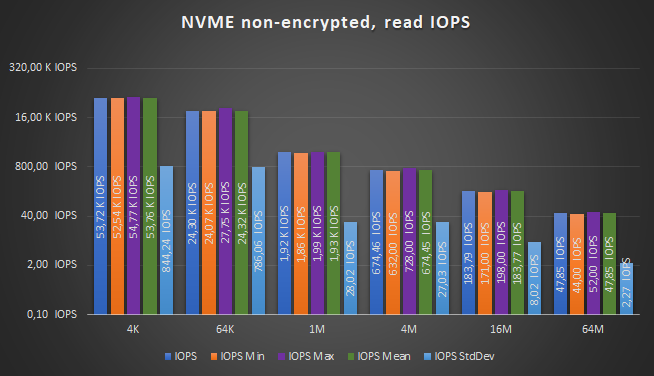
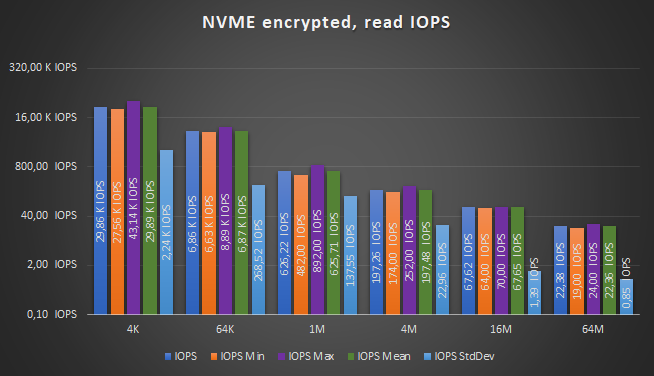
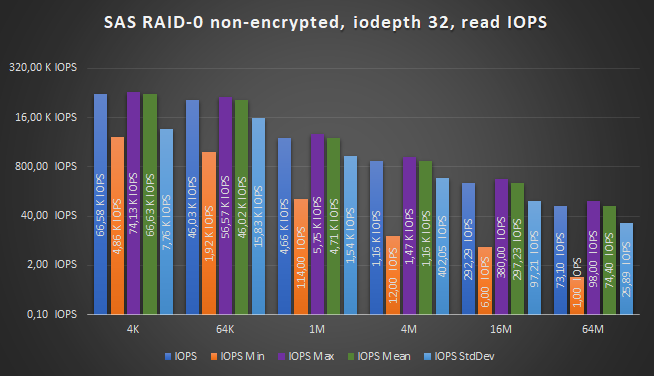
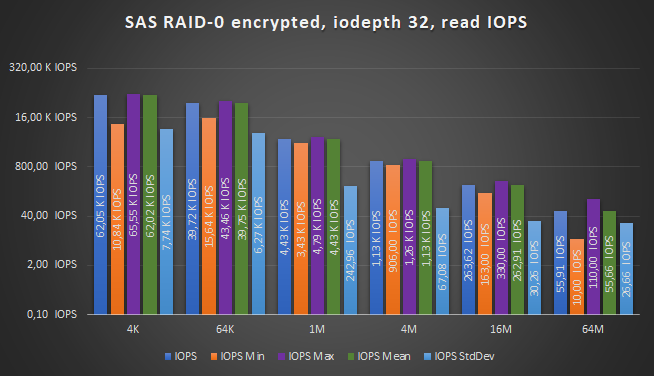
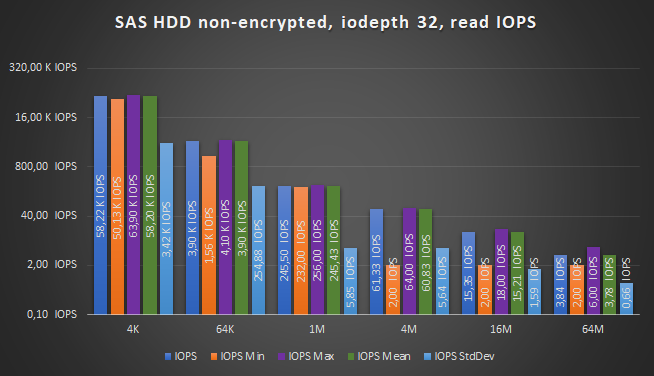
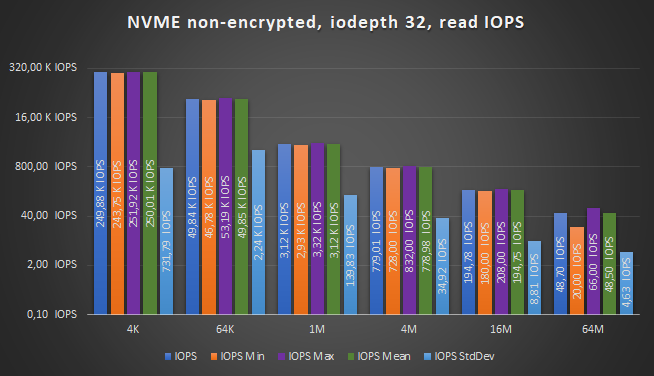
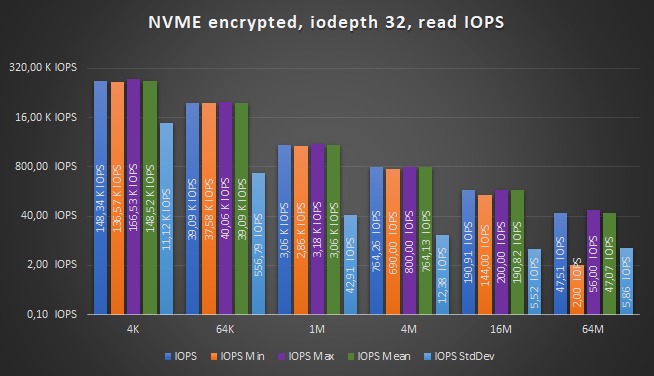
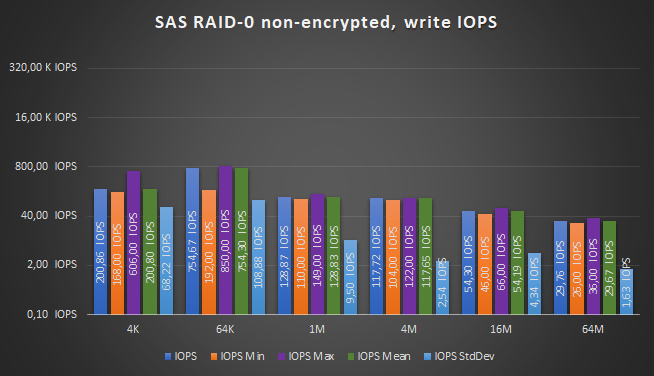
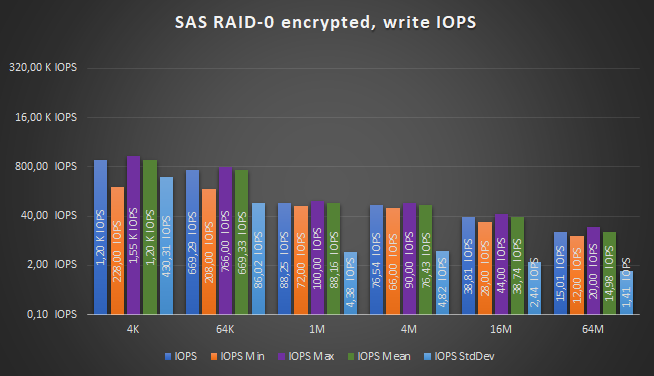
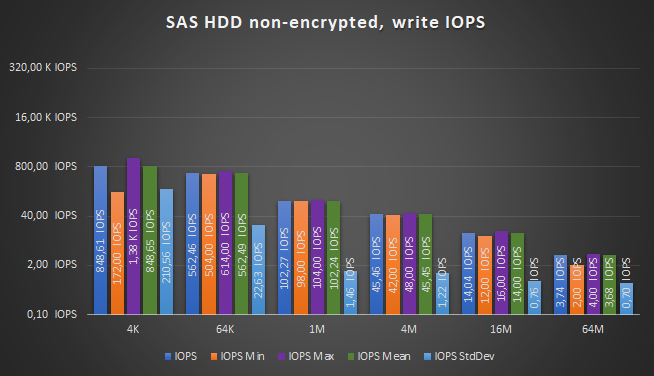
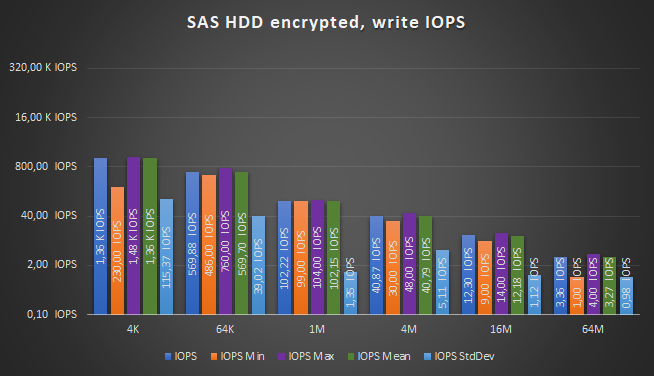
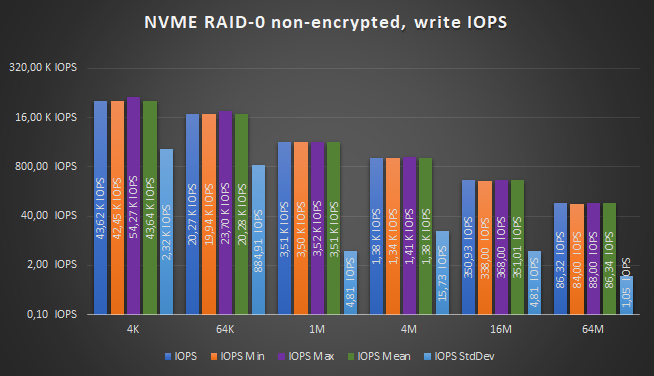
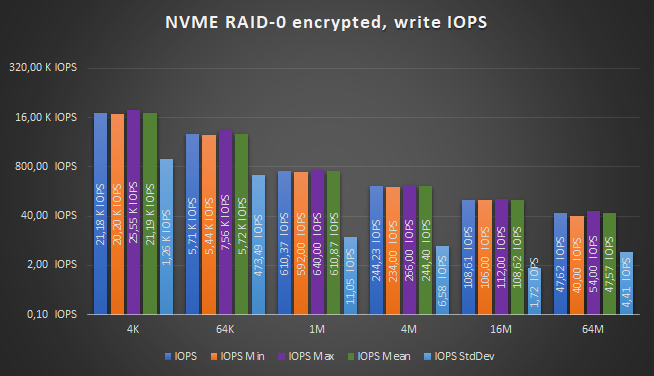
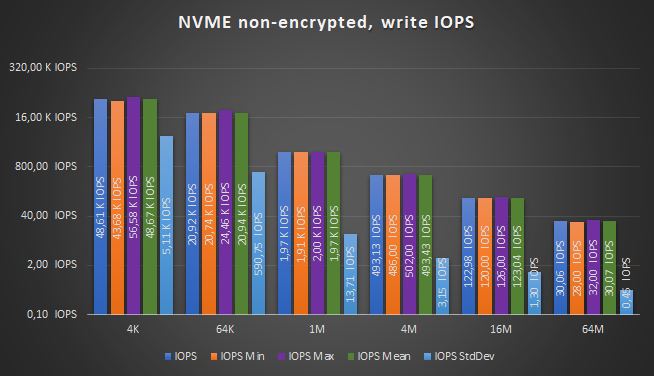
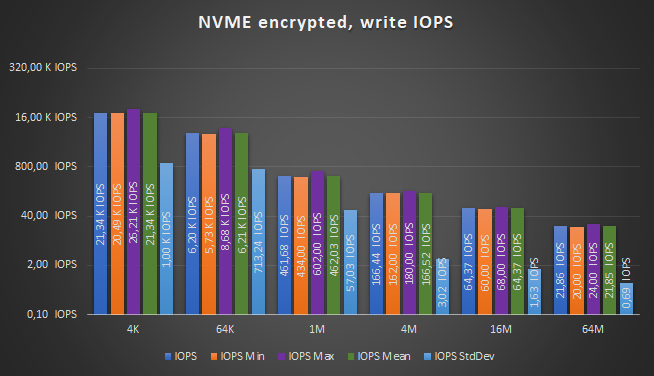
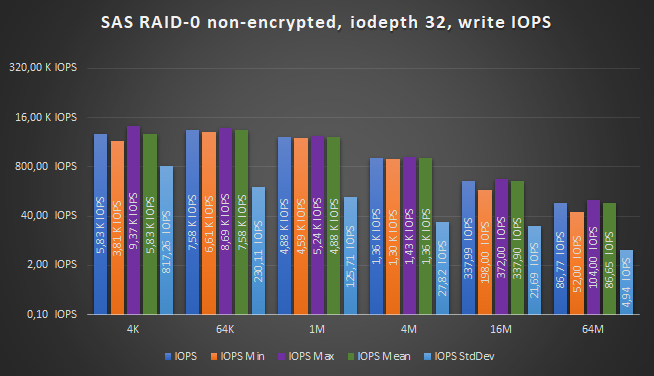
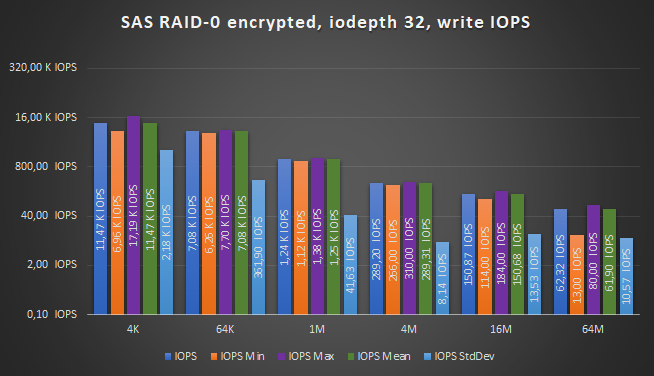
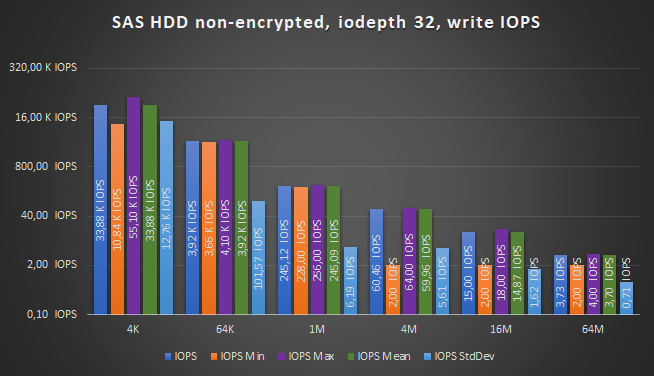
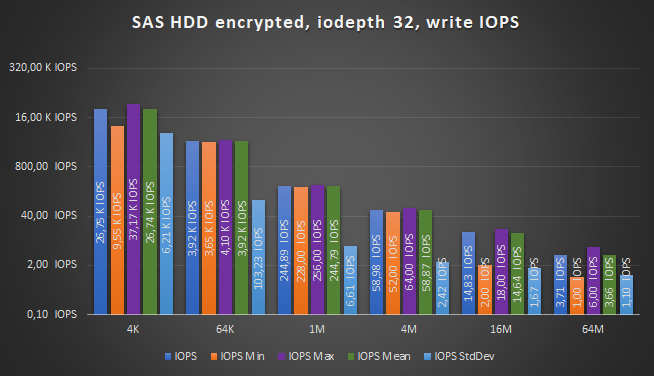
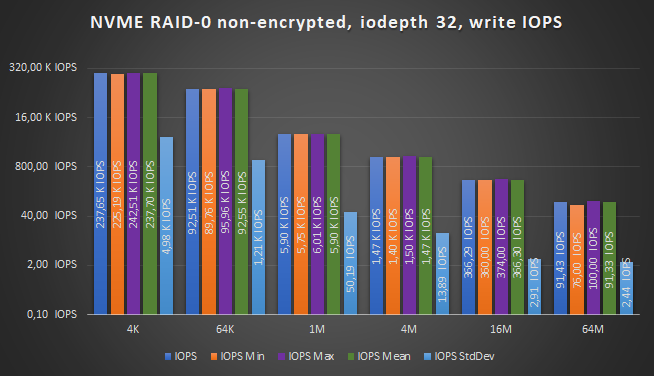
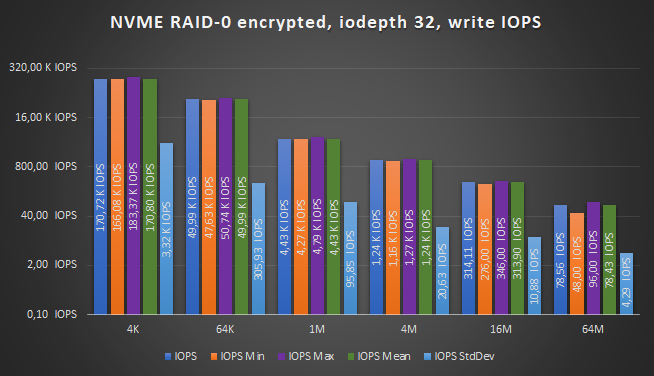
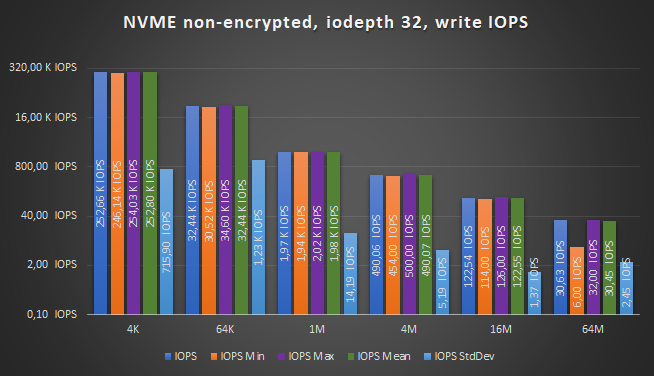
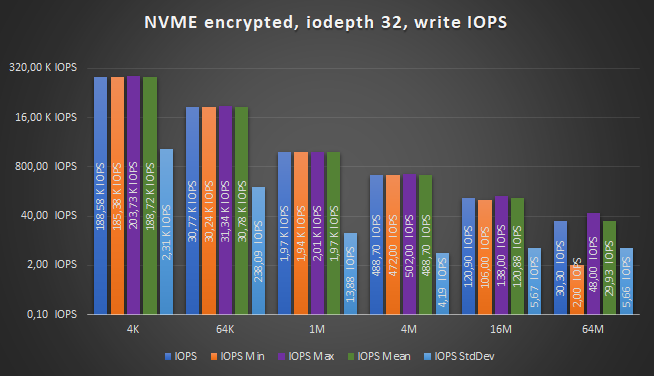
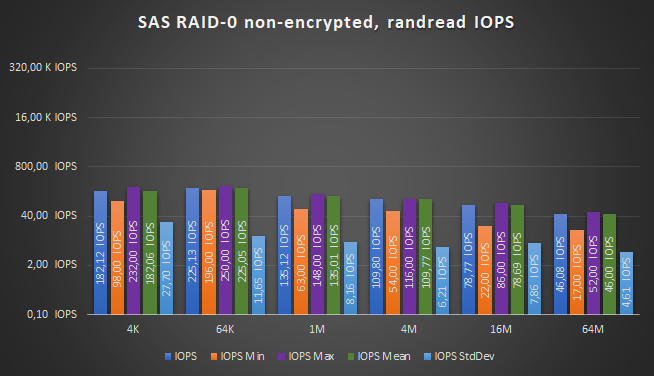
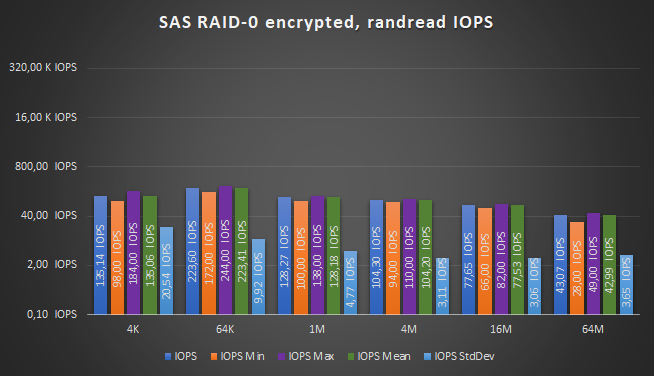
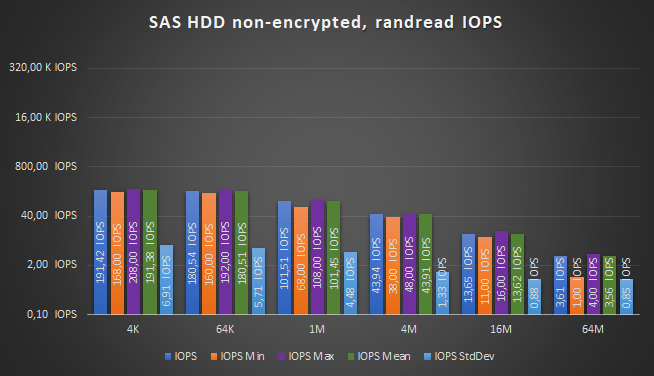
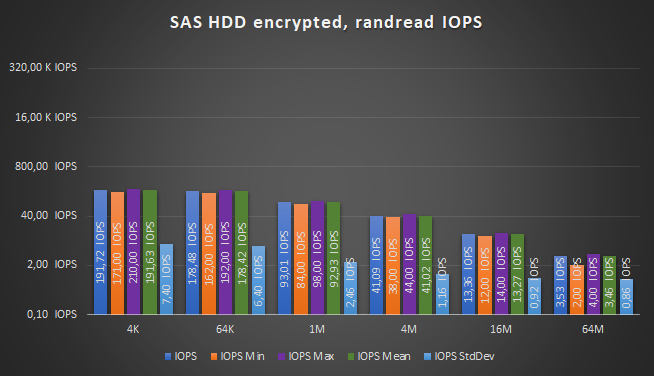
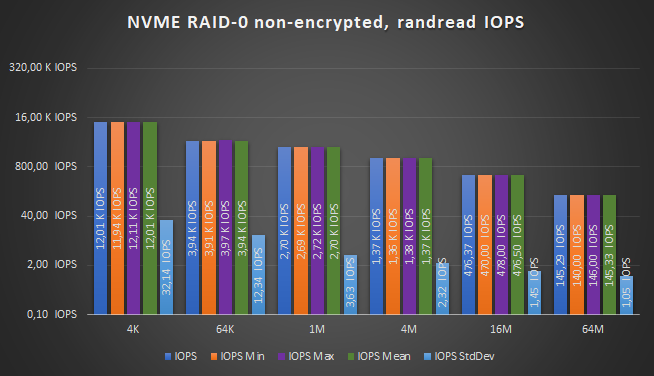
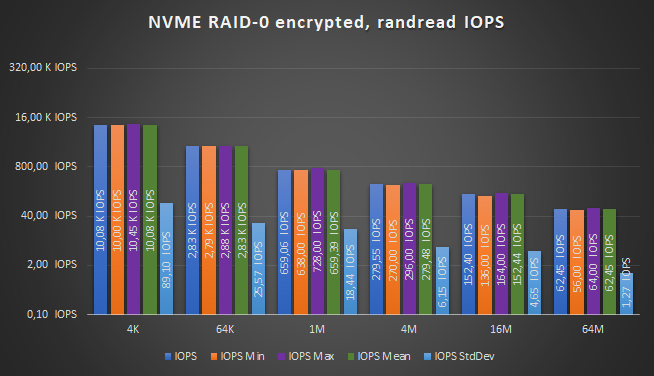
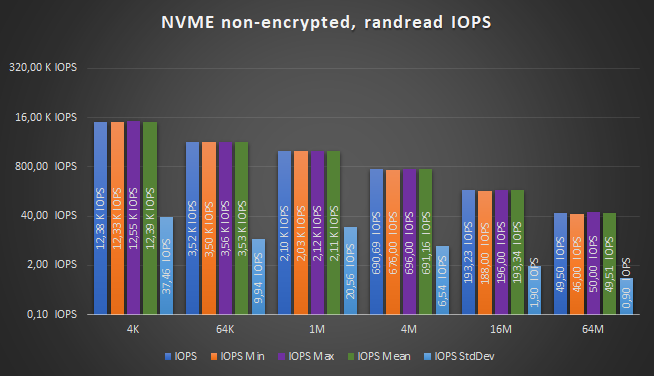
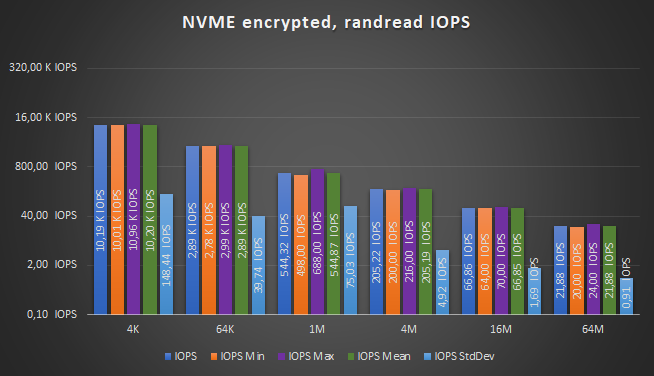
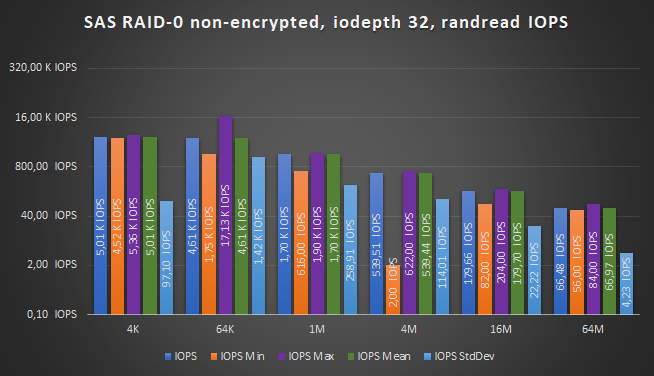
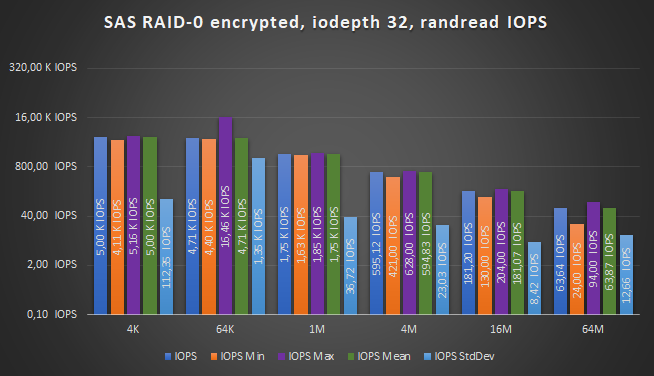
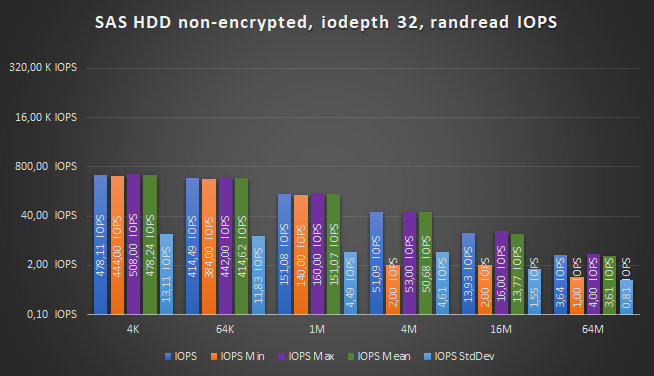
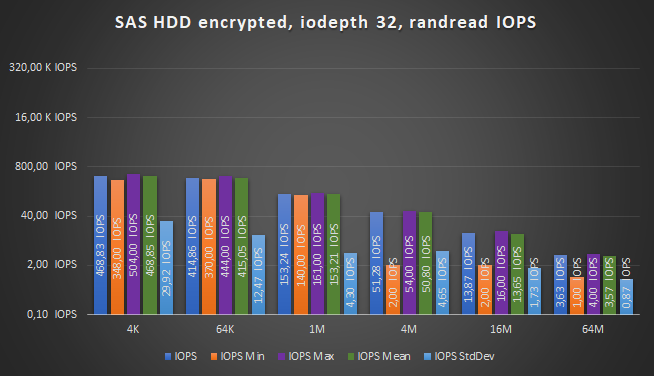
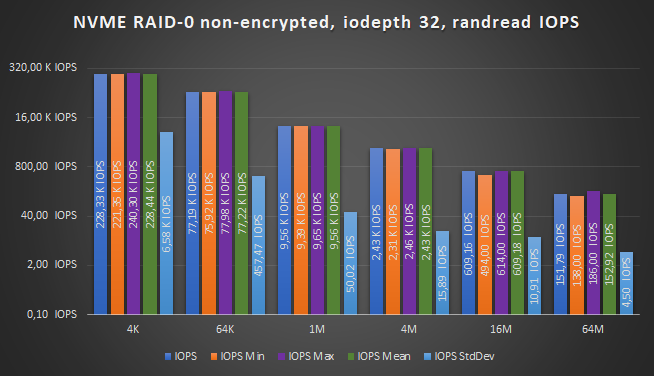
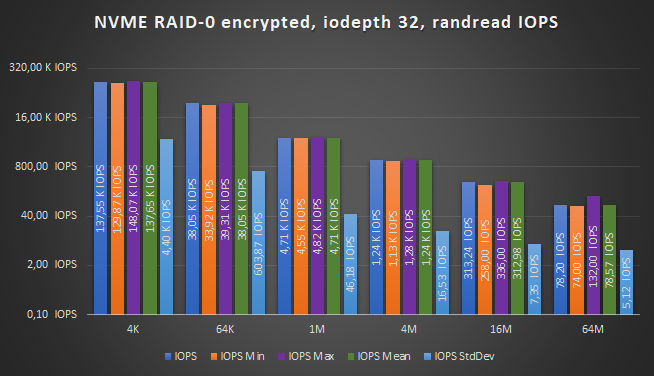
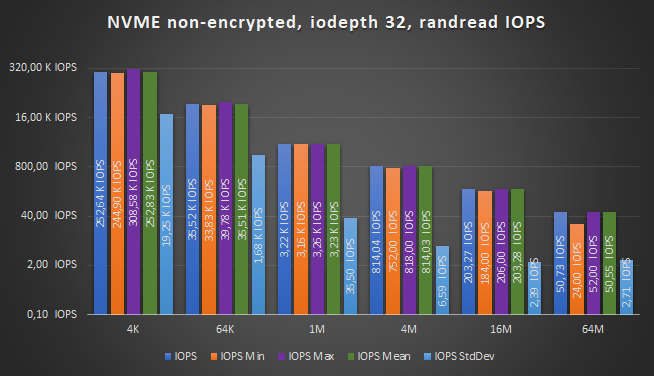
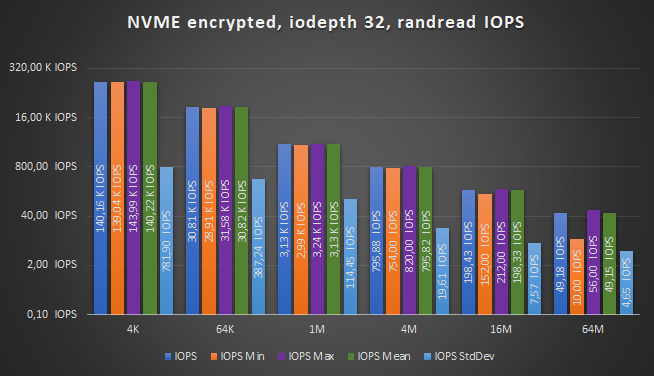
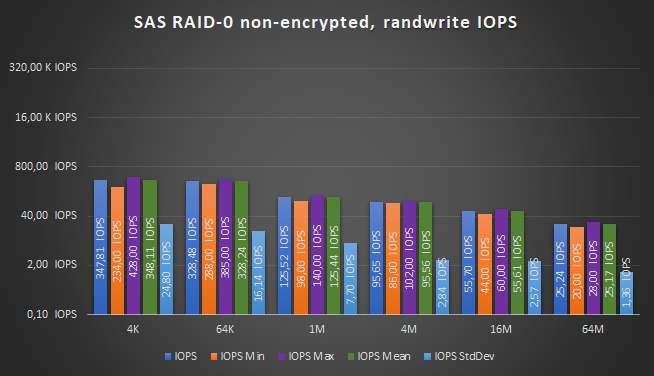
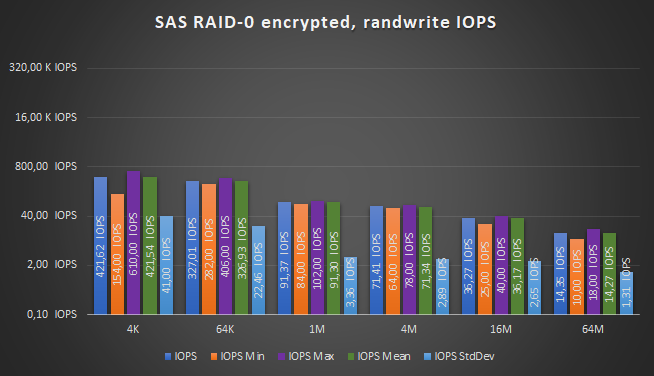
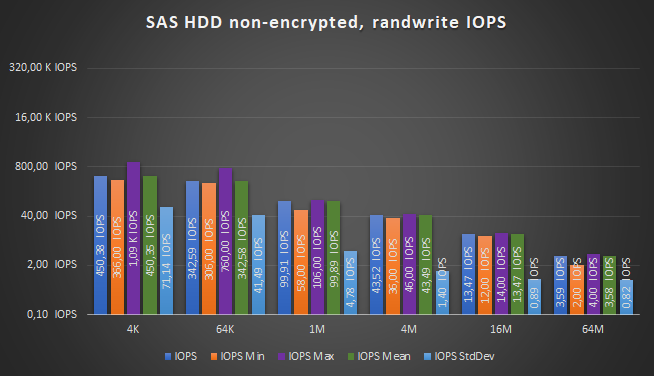
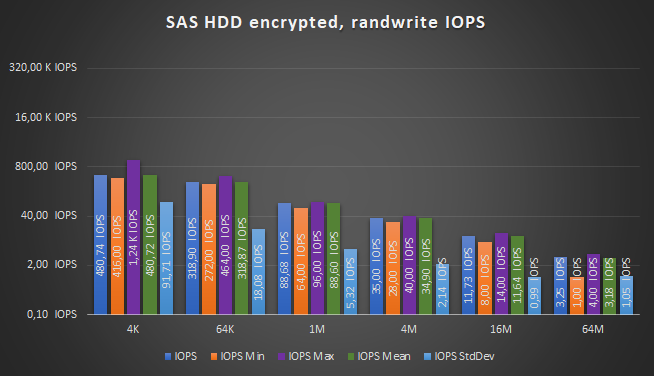
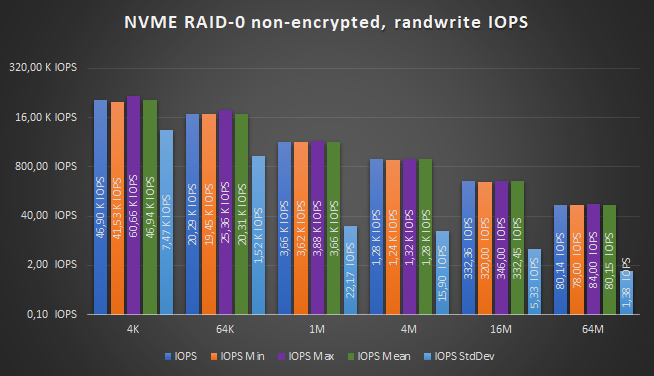
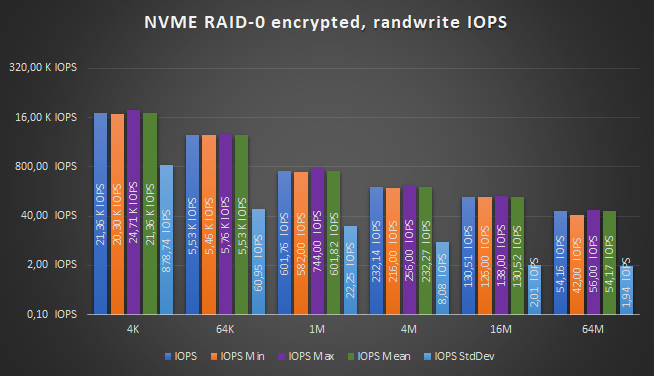
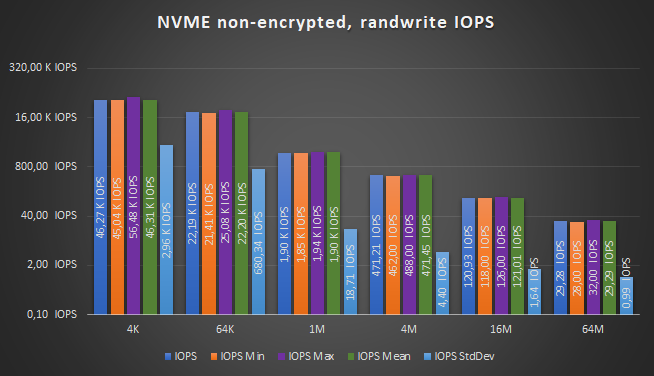
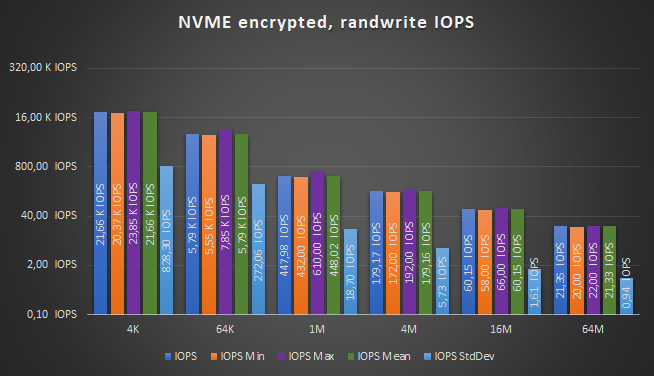
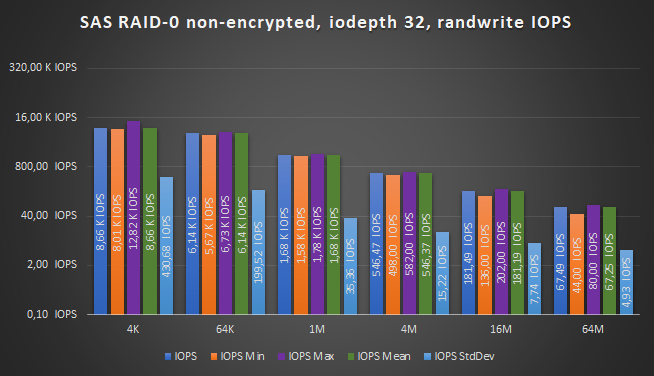
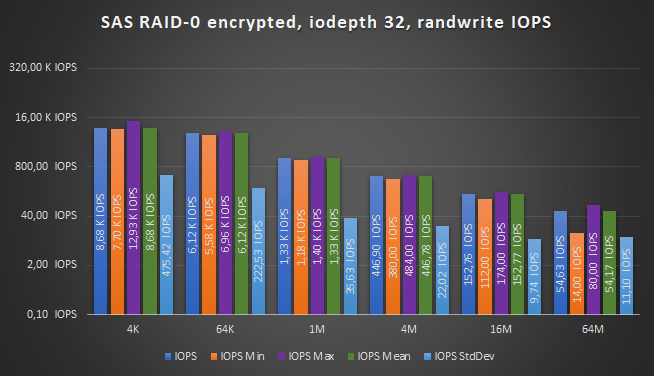
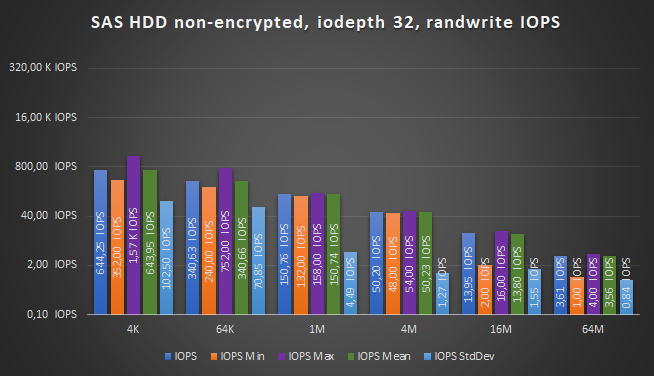
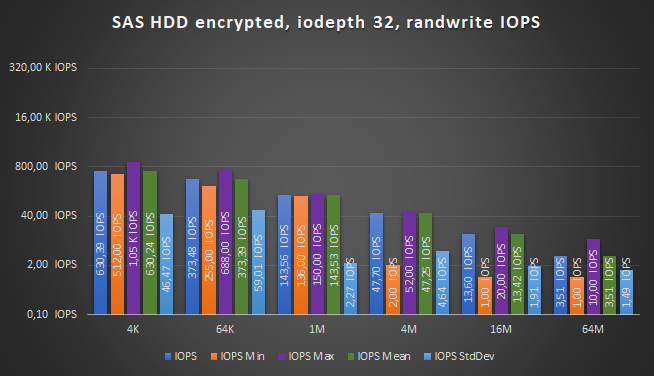
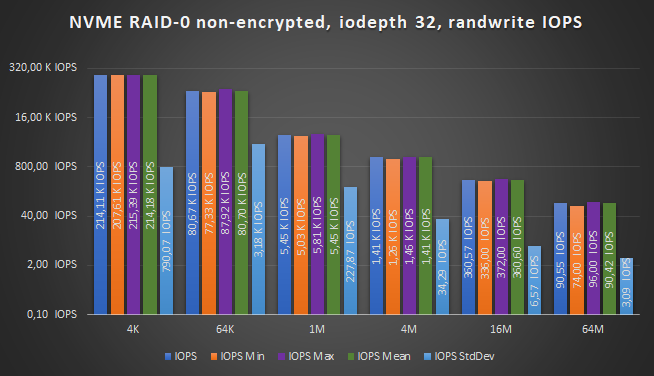
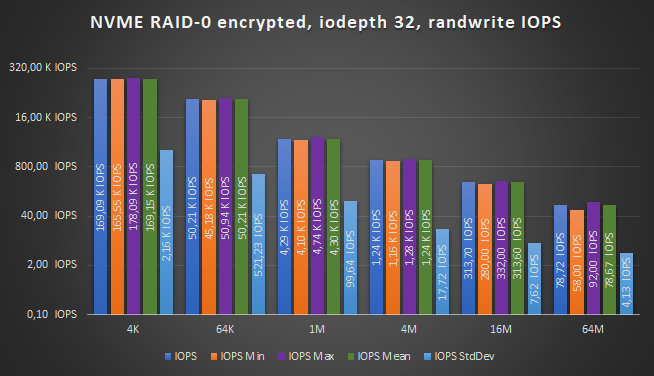
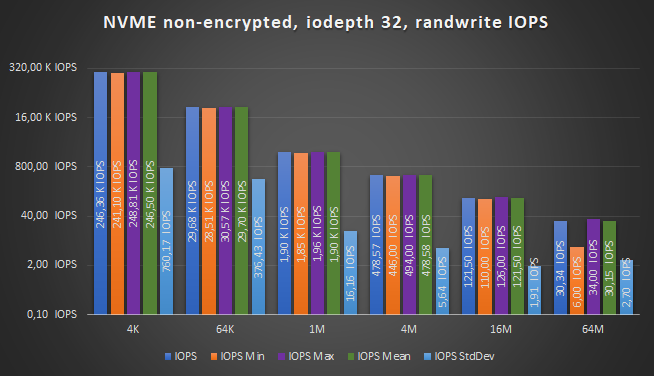
Now let’s have a look at the fio results for single disks and RAID-0, both encrypted and non-encrypted.
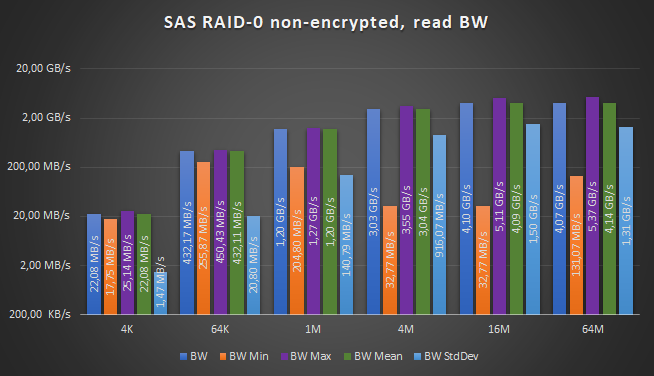
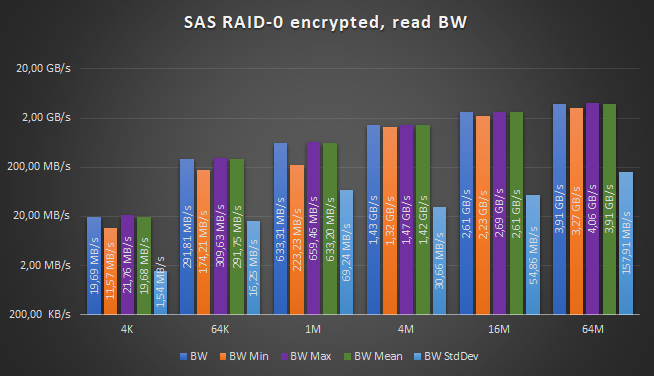
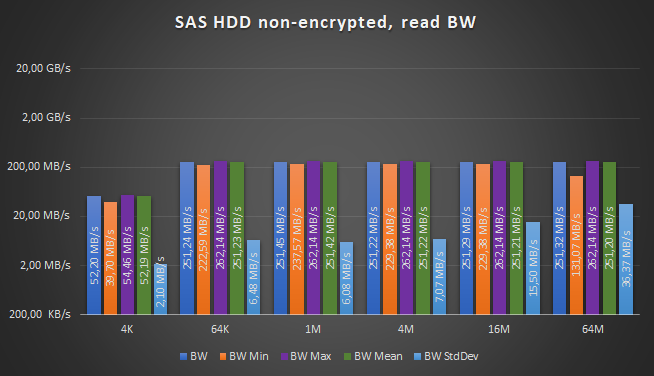
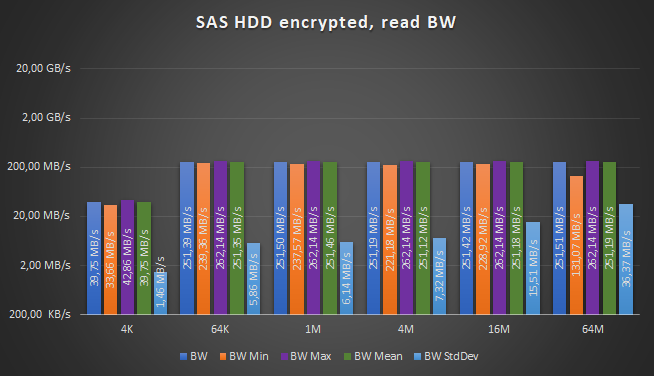
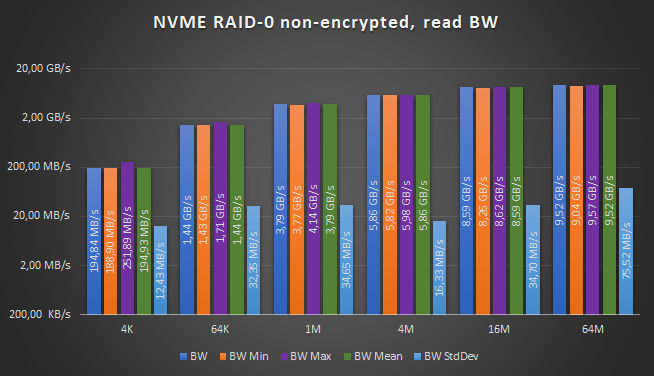
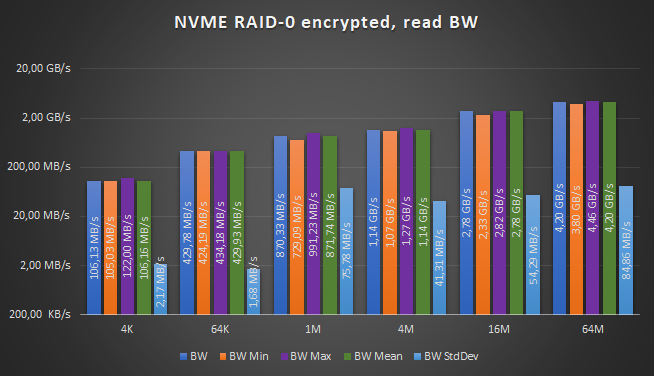
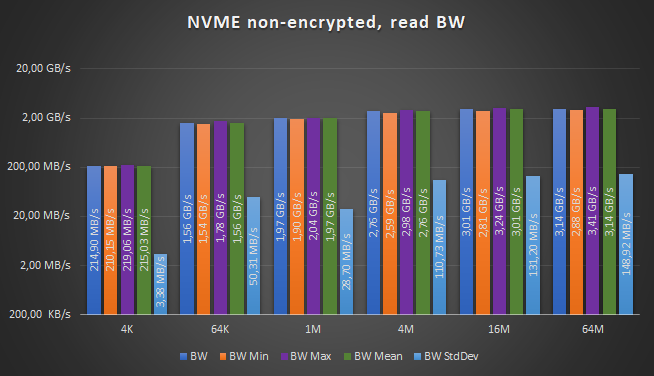
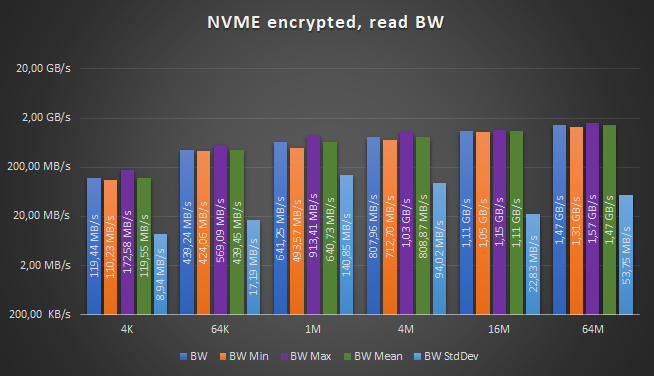
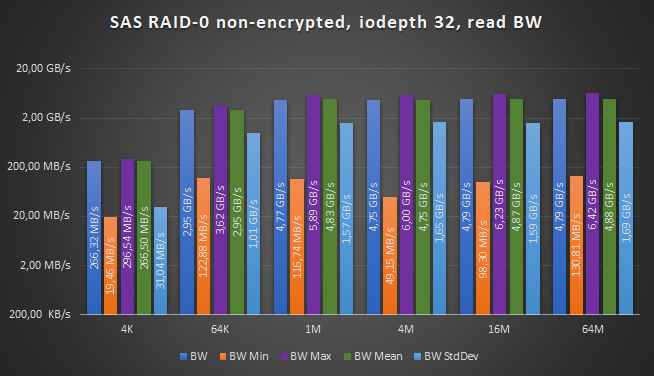
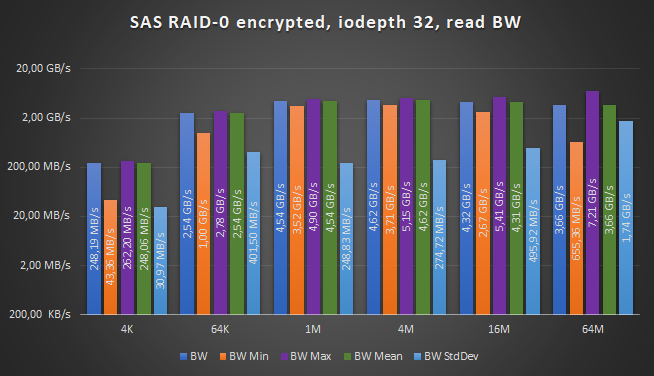
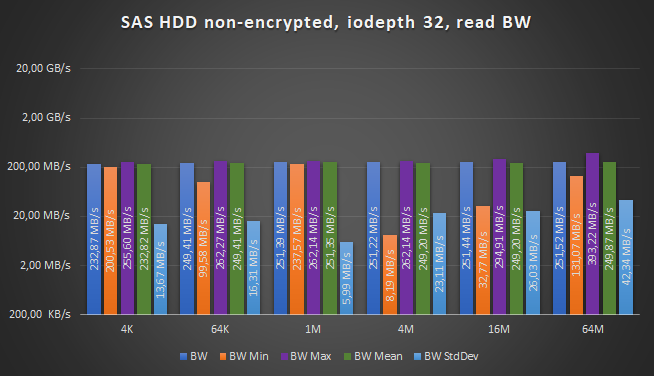
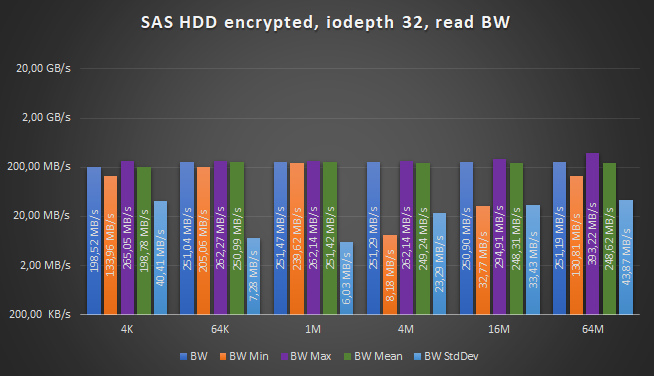
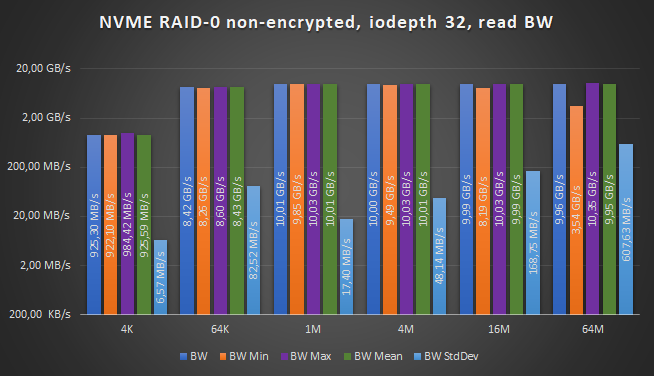
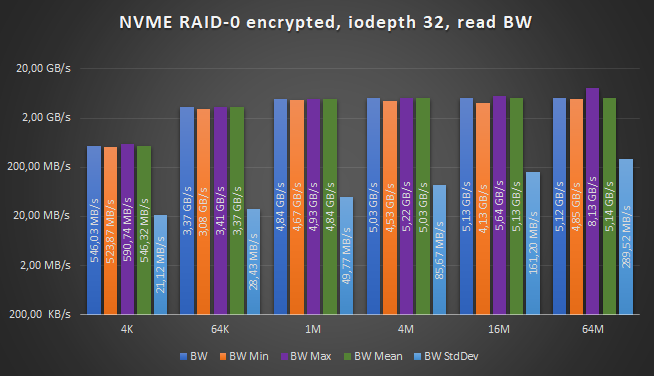
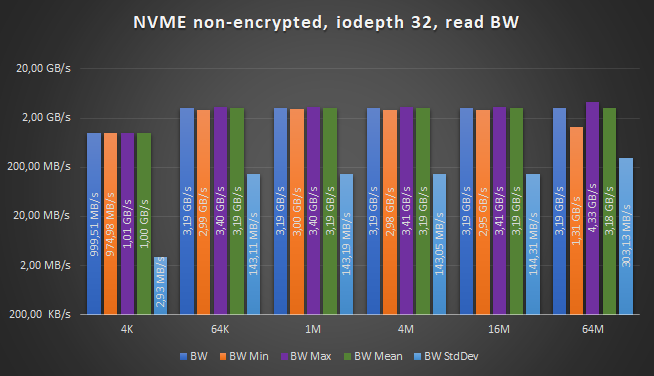
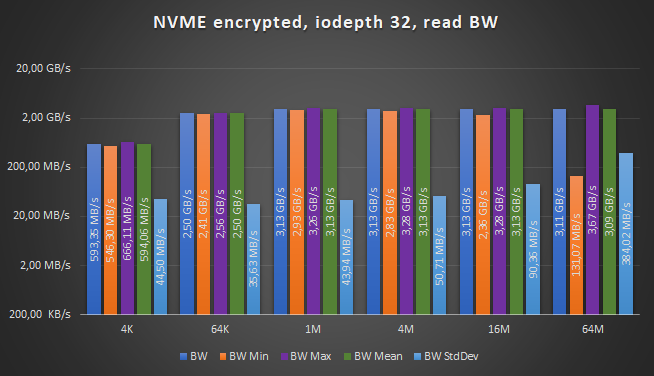
Caution: Scales are logarithmic!
| Device | 4 KiB % loss | 64 KiB % loss | 1 MiB % loss | 4 MiB % loss | 16 MiB % loss | 64 MiB % loss |
|---|---|---|---|---|---|---|
| SAS RAID-0 | 10,82 % | 32,48 % | 47,36 % | 52,95 % | 36,26 % | 3,86 % |
| SAS HDD | 23,86 % | -0,06 % | -0,02 % | 0,01 % | -0,05 % | -0,08 % |
| NVME RAID-0 | 45,53 % | 70,13 % | 77,05 % | 80,61 % | 67,65 % | 55,88 % |
| NVME | 44,42 % | 71,76 % | 67,46 % | 70,75 % | 63,21 % | 53,24 % |
| SAS RAID-0 iodepth=32 | 6,81 % | 13,71 % | 4,92 % | 2,66 % | 9,81 % | 23,52 % |
| SAS HDD iodepth=32 | 14,75 % | -0,65 % | -0,03 % | -0,03 % | 0,21 % | 0,13 % |
| NVME RAID-0 iodepth=32 | 40,99 % | 60,02 % | 51,61 % | 49,68 % | 48,62 % | 48,62 % |
| NVME iodepth=32 | 40,64 % | 21,57 % | 1,89 % | 1,89 % | 1,98 % | 2,43 % |
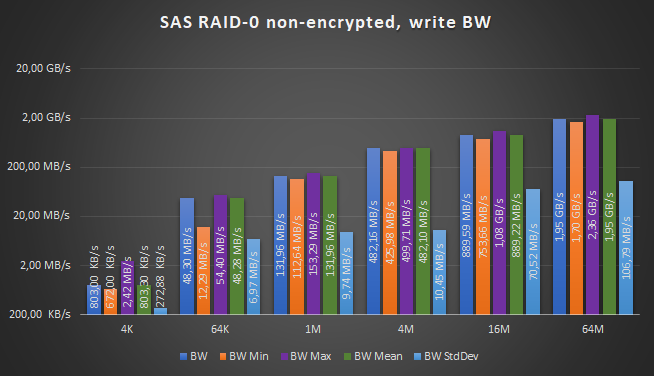
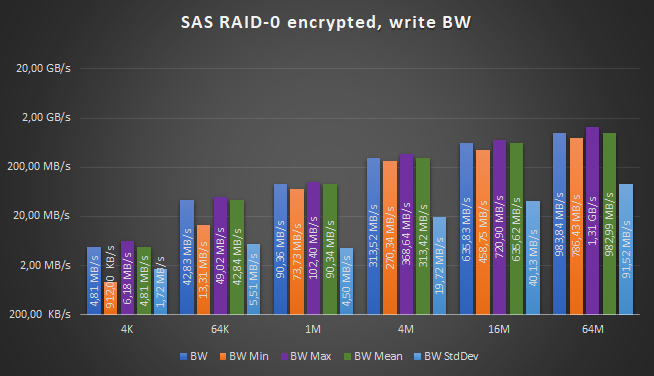
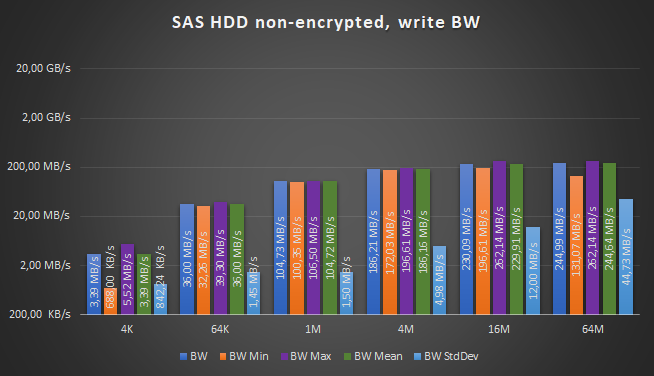

Caution: Scales are logarithmic!
| Device | 4 KiB % loss | 64 KiB % loss | 1 MiB % loss | 4 MiB % loss | 16 MiB % loss | 64 MiB % loss |
|---|---|---|---|---|---|---|
| SAS RAID-0 | -499,50 % | 11,31 % | 31,52 % | 34,98 % | 28,53 % | 49,55 % |
| SAS HDD | -59,93 % | -1,32 % | 0,05 % | 10,11 % | 12,43 % | 10,18 % |
| NVME RAID-0 | 51,45 % | 71,81 % | 82,63 % | 82,36 % | 69,05 % | 44,83 % |
| NVME | 56,11 % | 70,36 % | 76,52 % | 66,25 % | 47,66 % | 27,29 % |
| SAS RAID-0 iodepth=32 | -96,72 % | 6,58 % | 74,51 % | 78,72 % | 55,36 % | 28,17 % |
| SAS HDD iodepth=32 | 21,05 % | 0,04 % | 0,10 % | 2,43 % | 1,13 % | 0,59 % |
| NVME RAID-0 iodepth=32 | 28,16 % | 45,96 % | 24,97 % | 15,79 % | 14,24 % | 14,08 % |
| NVME iodepth=32 | 25,36 % | 5,14 % | 0,10 % | 0,28 % | 1,34 % | 1,09 % |
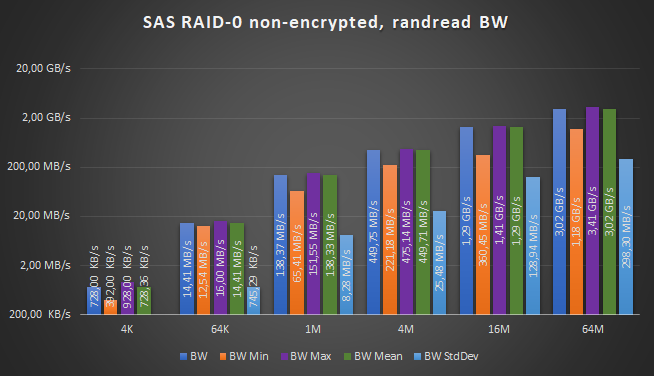
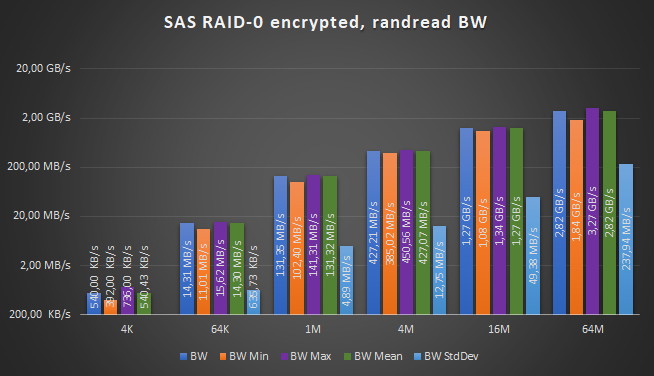
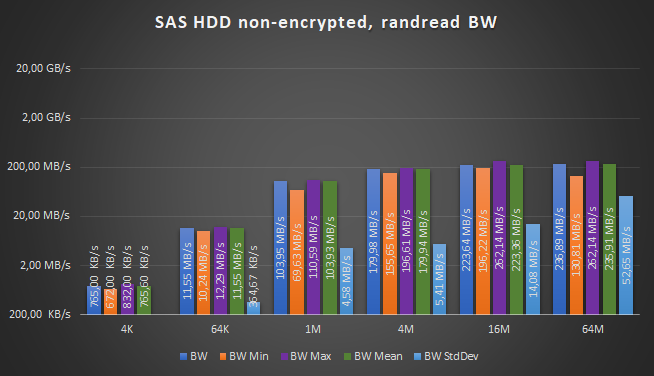
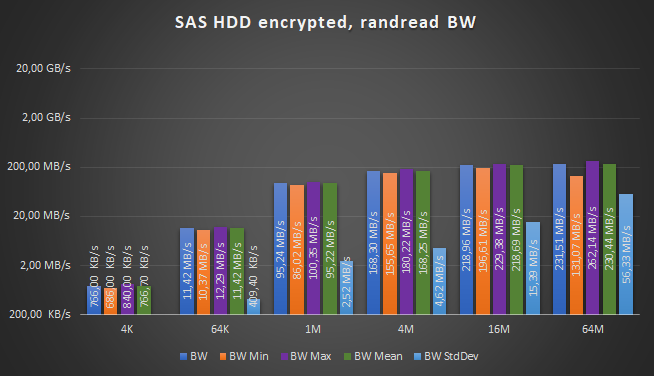
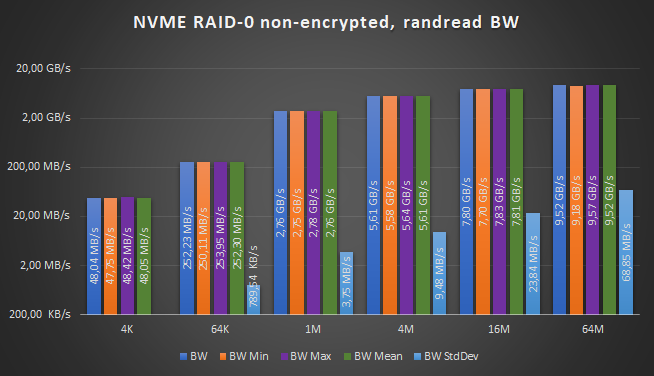
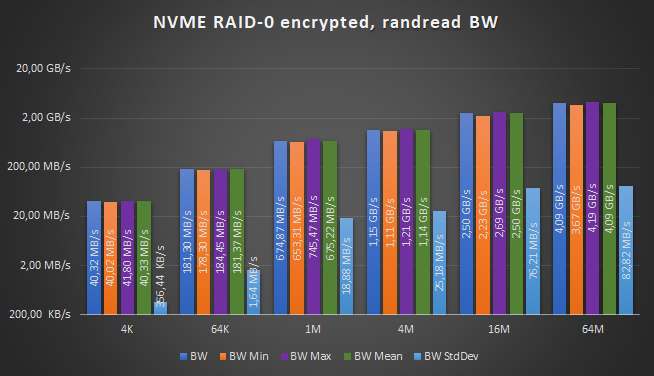
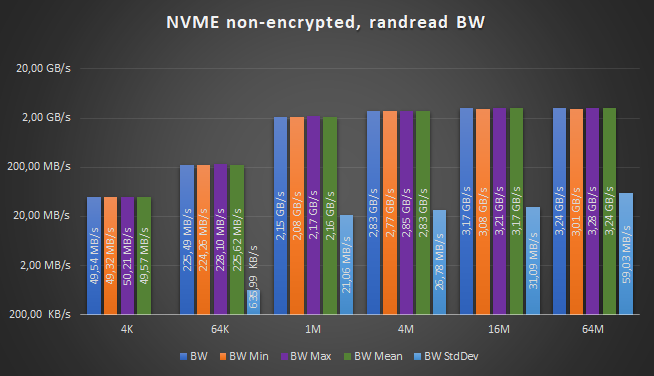
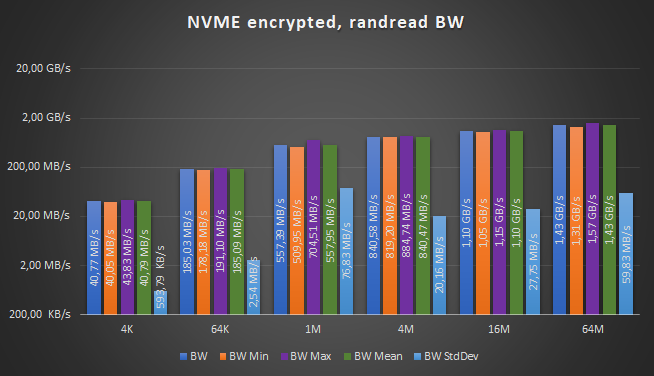
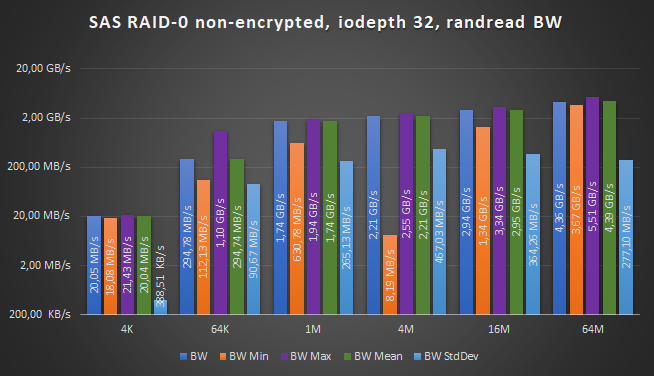
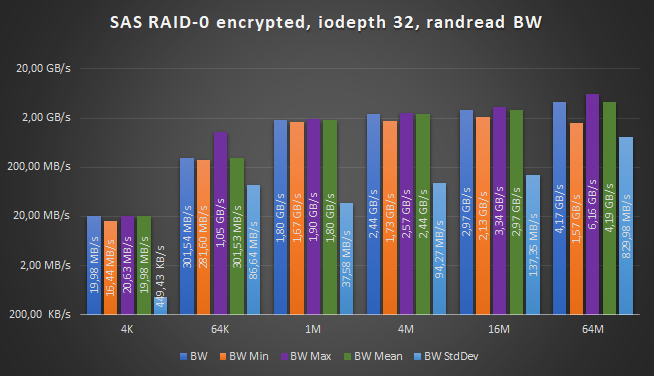

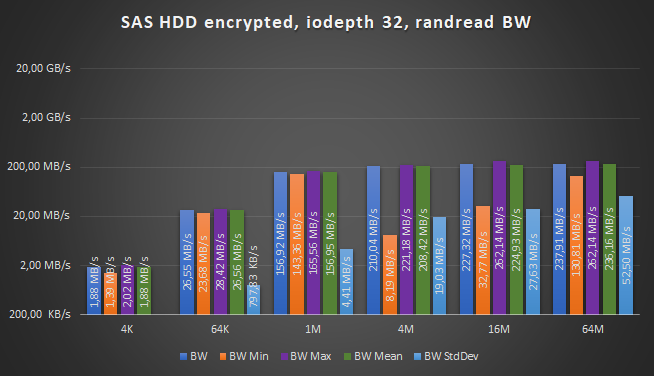
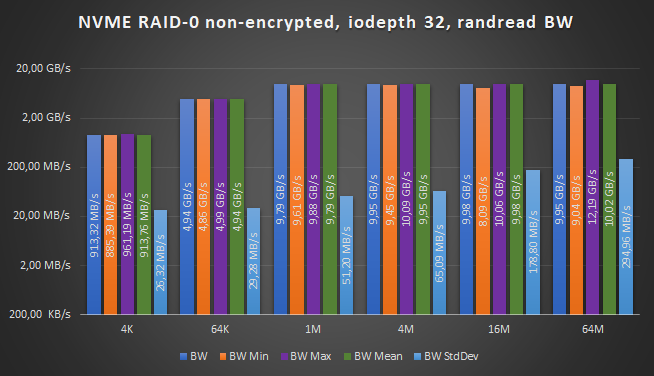
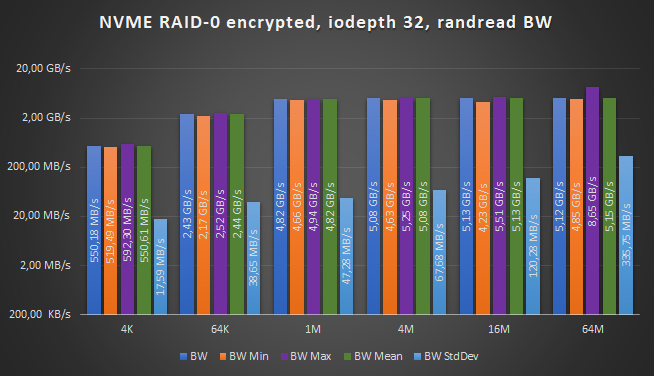
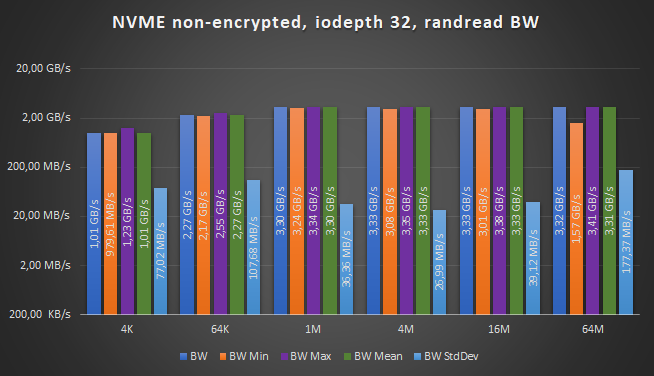
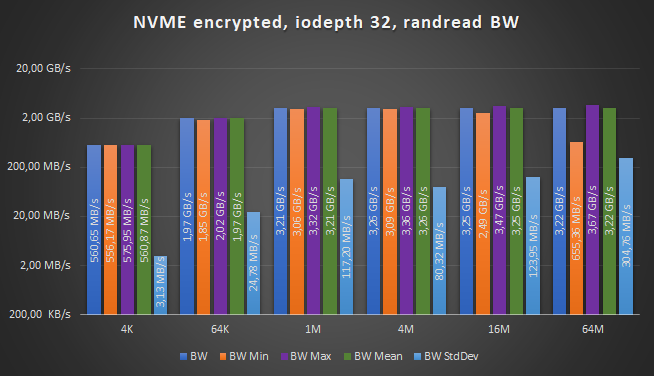
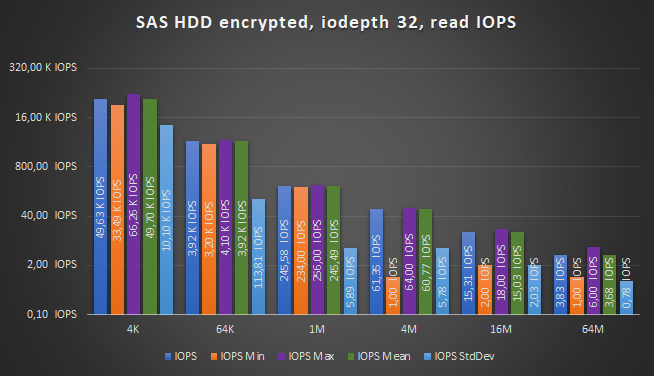
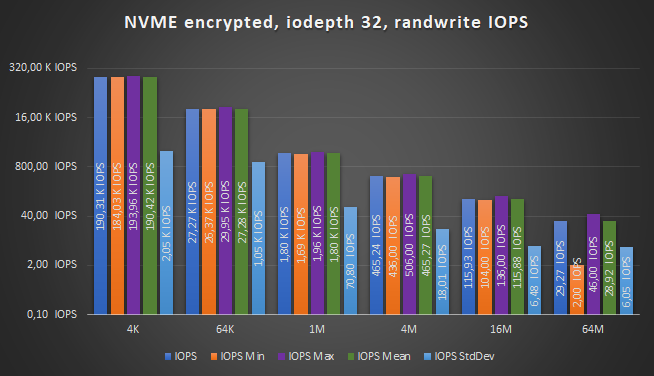
Caution: Scales are logarithmic!
| Device | 4 KiB % loss | 64 KiB % loss | 1 MiB % loss | 4 MiB % loss | 16 MiB % loss | 64 MiB % loss |
|---|---|---|---|---|---|---|
| SAS RAID-0 | 25,82 % | 0,68 % | 5,07 % | 5,01 % | 1,41 % | 6,52 % |
| SAS HDD | -0,13 % | 1,14 % | 8,37 % | 6,49 % | 2,09 % | 2,27 % |
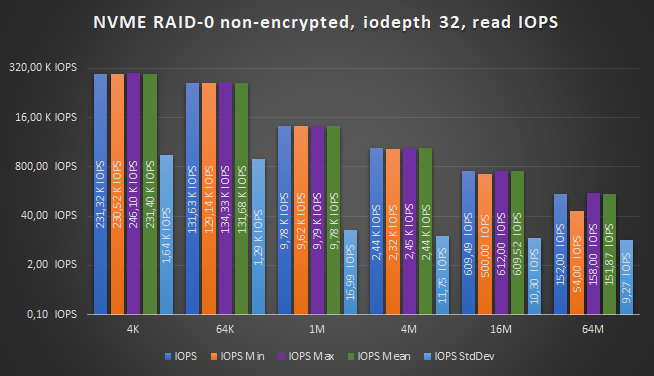
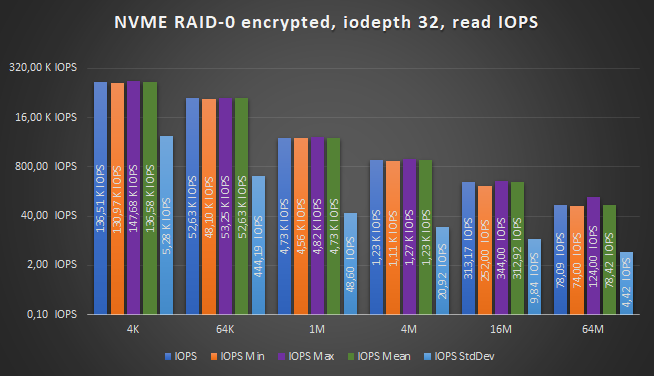
| NVME RAID-0 | 16,07 % | 28,12 % | 75,55 % | 79,59 % | 68,01 % | 57,02 % |
| NVME | 17,70 % | 17,95 % | 74,13 % | 70,29 % | 65,40 % | 55,81 % |
| SAS RAID-0 iodepth=32 | 0,30 % | -2,29 % | -3,12 % | -10,31 % | -0,86 % | 4,27 % |
| SAS HDD iodepth=32 | 1,94 % | -0,09 % | -1,43 % | -0,37 % | 0,41 % | 0,33 % |
| NVME RAID-0 iodepth=32 | 39,76 % | 50,71 % | 50,76 % | 48,91 % | 48,58 % | 48,48 % |
| NVME iodepth=32 | 44,52 % | 13,26 % | 2,84 % | 2,23 % | 2,38 % | 3,05 % |
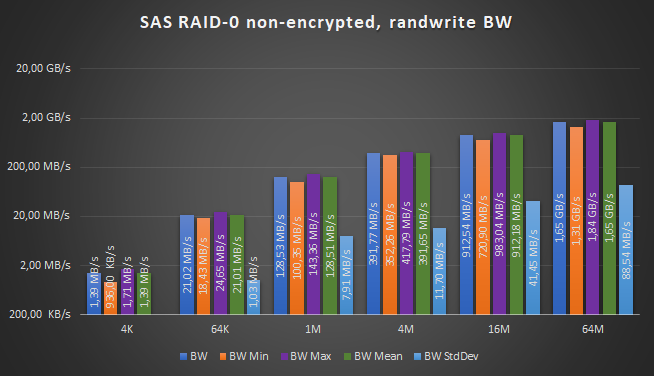

Caution: Scales are logarithmic!
| Device | 4 KiB % loss | 64 KiB % loss | 1 MiB % loss | 4 MiB % loss | 16 MiB % loss | 64 MiB % loss |
|---|---|---|---|---|---|---|
| SAS RAID-0 | -21,21 % | 0,45 % | 27,20 % | 25,34 % | 34,89 % | 43,14 % |
| SAS HDD | -6,72 % | 6,91 % | 11,24 % | 19,57 % | 12,97 % | 9,49 % |
| NVME RAID-0 | 54,45 % | 72,75 % | 83,56 % | 81,83 % | 60,73 % | 32,43 % |
| NVME | 53,20 % | 73,91 % | 76,44 % | 61,98 % | 50,27 % | 27,10 % |
| SAS RAID-0 iodepth=32 | -0,23 % | 0,38 % | 20,77 % | 18,22 % | 15,83 % | 19,05 % |
| SAS HDD iodepth=32 | 2,17 % | -9,64 % | 4,78 % | 4,98 % | 2,51 % | 2,56 % |
| NVME RAID-0 iodepth=32 | 21,03 % | 37,76 % | 21,16 % | 12,26 % | 13,00 % | 13,06 % |
| NVME iodepth=32 | 22,75 % | 8,13 % | 5,57 % | 2,78 % | 4,58 % | 3,51 % |
Caution: Scales are logarithmic!
| Device | 4 KiB % loss | 64 KiB % loss | 1 MiB % loss | 4 MiB % loss | 16 MiB % loss | 64 MiB % loss |
|---|---|---|---|---|---|---|
| SAS RAID-0 | 10,82 % | 32,48 % | 47,36 % | 52,95 % | 36,26 % | 3,86 % |
| SAS HDD | 23,86 % | -0,06 % | -0,02 % | 0,01 % | -0,05 % | -0,08 % |
| NVME RAID-0 | 45,53 % | 70,13 % | 77,05 % | 80,61 % | 67,65 % | 55,88 % |
| NVME | 44,42 % | 71,76 % | 67,46 % | 70,75 % | 63,21 % | 53,24 % |
| SAS RAID-0 iodepth=32 | 6,81 % | 13,71 % | 4,92 % | 2,66 % | 9,81 % | 23,52 % |
| SAS HDD iodepth=32 | 14,75 % | -0,65 % | -0,03 % | -0,03 % | 0,21 % | 0,13 % |
| NVME RAID-0 iodepth=32 | 40,99 % | 60,02 % | 51,61 % | 49,68 % | 48,62 % | 48,62 % |
| NVME iodepth=32 | 40,64 % | 21,57 % | 1,89 % | 1,89 % | 1,98 % | 2,43 % |
Caution: Scales are logarithmic!
| Device | 4 KiB % loss | 64 KiB % loss | 1 MiB % loss | 4 MiB % loss | 16 MiB % loss | 64 MiB % loss |
|---|---|---|---|---|---|---|
| SAS RAID-0 | -499,50 % | 11,31 % | 31,52 % | 34,98 % | 28,53 % | 49,55 % |
| SAS HDD | -59,93 % | -1,32 % | 0,05 % | 10,11 % | 12,43 % | 10,18 % |
| NVME RAID-0 | 51,45 % | 71,81 % | 82,63 % | 82,36 % | 69,05 % | 44,83 % |
| NVME | 56,11 % | 70,36 % | 76,52 % | 66,25 % | 47,66 % | 27,29 % |
| SAS RAID-0 iodepth=32 | -96,72 % | 6,58 % | 74,51 % | 78,72 % | 55,36 % | 28,17 % |
| SAS HDD iodepth=32 | 21,05 % | 0,04 % | 0,10 % | 2,43 % | 1,13 % | 0,59 % |
| NVME RAID-0 iodepth=32 | 28,16 % | 45,96 % | 24,97 % | 15,79 % | 14,24 % | 14,08 % |
| NVME iodepth=32 | 25,36 % | 5,14 % | 0,10 % | 0,28 % | 1,34 % | 1,09 % |
Caution: Scales are logarithmic!
| Device | 4 KiB % loss | 64 KiB % loss | 1 MiB % loss | 4 MiB % loss | 16 MiB % loss | 64 MiB % loss |
|---|---|---|---|---|---|---|
| SAS RAID-0 | 25,82 % | 0,68 % | 5,07 % | 5,01 % | 1,41 % | 6,52 % |
| SAS HDD | -0,13 % | 1,14 % | 8,37 % | 6,49 % | 2,09 % | 2,27 % |
| NVME RAID-0 | 16,07 % | 28,12 % | 75,55 % | 79,59 % | 68,01 % | 57,02 % |
| NVME | 17,70 % | 17,95 % | 74,13 % | 70,29 % | 65,40 % | 55,81 % |
| SAS RAID-0 iodepth=32 | 0,30 % | -2,29 % | -3,12 % | -10,31 % | -0,86 % | 4,27 % |
| SAS HDD iodepth=32 | 1,94 % | -0,09 % | -1,43 % | -0,37 % | 0,41 % | 0,33 % |
| NVME RAID-0 iodepth=32 | 39,76 % | 50,71 % | 50,76 % | 48,91 % | 48,58 % | 48,48 % |
| NVME iodepth=32 | 44,52 % | 13,26 % | 2,84 % | 2,23 % | 2,38 % | 3,05 % |
Caution: Scales are logarithmic!
| Device | 4 KiB % loss | 64 KiB % loss | 1 MiB % loss | 4 MiB % loss | 16 MiB % loss | 64 MiB % loss |
|---|---|---|---|---|---|---|
| SAS RAID-0 | -21,21 % | 0,45 % | 27,20 % | 25,34 % | 34,89 % | 43,14 % |
| SAS HDD | -6,72 % | 6,91 % | 11,24 % | 19,57 % | 12,97 % | 9,49 % |
| NVME RAID-0 | 54,45 % | 72,75 % | 83,56 % | 81,83 % | 60,73 % | 32,43 % |
| NVME | 53,20 % | 73,91 % | 76,44 % | 61,98 % | 50,27 % | 27,10 % |
| SAS RAID-0 iodepth=32 | -0,23 % | 0,38 % | 20,77 % | 18,22 % | 15,83 % | 19,05 % |
| SAS HDD iodepth=32 | 2,17 % | -9,64 % | 4,78 % | 4,98 % | 2,51 % | 2,56 % |
| NVME RAID-0 iodepth=32 | 21,03 % | 37,76 % | 21,16 % | 12,26 % | 13,00 % | 13,06 % |
| NVME iodepth=32 | 22,75 % | 8,13 % | 5,57 % | 2,78 % | 4,58 % | 3,51 % |
Although modern CPUs provide AES acceleration through AES-NI instructions, the overall performance penalty especially when using NVME drives is too big to recommend turning it on everywhere.
Self encrypting drives technically work but the tooling around them is still in its infancy and as of yet not suitable for use in a DC environment until server manufacturers incorporate the necessary options in their firmware and the tools for managing SEDs under linux significantly improve in documentation and user friendliness.
SEDs also suffer in the aspect of having to trust that the drive manufacturer implemented the cryptography correctly and didn’t add backdoors into it. Recent history has shown that this isn’t always the case as some (albeit consumer grade) SSDs didn’t encrypt data at all and even allowed access without knowing the passphrase.
(This was a problem with e.g. Microsoft’s BitLocker relying on the drive to perform the cryptography and afaik subsequently was fixed by Microsoft.)
Crypto accelerators could be a solution here, however it’d be nice to see that technology embedded into servers directly since cryptography nowadays is a must-have.
Thank you for reading this blog post!